Radares Mirando al Sur

Fundamentos, Tecnologías, Aplicaciones, Historia y Memoria

Etiqueta: WMO

  • The Polarimetric Classifier That Sees Snow in the Caribbean

    The Polarimetric Classifier That Sees Snow in the Caribbean

    A post about hydrometeor classification in polarimetric radars, regional bias, and the invisible geography of algorithms. Versión en español aquí.

    Hydrometeor classifiers (HCA/HID) operating in commercial polarimetric radars are, for the most part, fuzzy logic implementations built from observational campaigns, electromagnetic simulations, and microphysical knowledge generated in mid-latitudes. When these classifiers are deployed in tropical regions — such as the Caribbean or northern South America — their membership functions and decision thresholds no longer represent local physics. This article examines the case of two manufacturers (EEC and Vaisala), two countries (Jamaica and Colombia), and argues that the bias is not a calibration defect but a structural consequence of importing regional models disguised as universal products. A local validation framework is proposed and its application to microburst detection is explored.

    1. Introduction: A Complaint That Wasn’t Technical

    A colleague of mine at Colombia’s Civil Aviation Authority worked with data from a Doppler and Polarimetric radar. A few years ago we met, and she told me a complaint that wasn’t technical but almost existential: her radar’s hydrometeor classifier was flagging snow in warm regions of the country. Regions where the 0 °C isotherm sits at 4,800 meters and where it has never snowed at ground level. Pilots reported rain. The classifier insisted on snow.

    She knew the radar was well calibrated. ZDR adjusted, PhiDP without offset, RhoHV coherent. And yet the flagship product — the one that tells you what kind of particle is falling from the sky — was lying.

    That complaint is the origin of this article. Because the problem wasn’t a bug. It was something deeper and more uncomfortable: the classifier didn’t know Colombia. And the same could be said of Jamaica. Or Puerto Rico. Or any place where a polarimetric radar looks at a sky for which its algorithm was not designed.

    2. Calibrating Is Not Classifying

    It’s worth separating two things that are often confused.

    Calibrating a polarimetric radar means ensuring that what it measures corresponds to what’s actually there. That Zh has no bias, that ZDR is centered, that PhiDP has no offset, that RhoHV reflects real coherence. It’s an instrumentation problem. Difficult, but bounded.

    Classifying hydrometeors is something else. It means taking those already-calibrated variables and deciding, through a model, whether what you’re seeing is light rain, heavy rain, big drops, hail, graupel, dry snow, wet snow, ice crystals, biota, or clutter. It’s an inference problem.

    The most common classifier in operational radars — in both EEC and Vaisala, as we’ll see — uses fuzzy logic. Membership functions are defined for each polarimetric variable, inference rules are built along the lines of «if Zh is high and ZDR is low and RhoHV is high, then probably hail,» and they’re combined to obtain a degree of membership for each class.

    The problem is that those functions and those rules don’t come out of thin air. They’re built, adjusted, and validated with observational campaigns, electromagnetic simulations, and in-situ measurements made in a specific place. And there’s the catch: that «specific place» is almost never the tropics.

    3. Two Cousins: EEC and Vaisala

    This is where the story gets interesting. Because one might think the problem belongs to a single manufacturer. It doesn’t. It belongs to a shared philosophy.

    3.1 EEC and the NOAA/NSSL Lineage

    Jamaica operates an EEC Defender, S-band, 8.5-meter antenna. EEC — Enterprise Electronics Corporation — is headquartered in Enterprise, Alabama. It’s not poetic coincidence: it’s literal. The radar watching the Caribbean from Jamaica was manufactured in a city in the southern United States.

    Everything indicates that EEC incorporated into its radars the classification line developed by the group of Alexander V. Ryzhkov and Dusan S. Zrnić at NOAA/NSSL, based on fuzzy logic. EEC’s own technical material points to their integration of the hydrometeor classification algorithms developed for the WSR-88D platform — the U.S. NEXRAD network — (Ryzhkov & Zrnić, 2019).

    That classifier primarily uses:

    • Zh (horizontal reflectivity)
    • ZDR (differential reflectivity)
    • RhoHV (correlation coefficient)
    • KDP (specific differential phase)
    • Temperature information
    • Melting layer detection

    And it classifies roughly ten categories: rain, heavy rain, big drops, small hail, large hail, graupel, dry snow, wet snow, ice crystals, and biological/non-meteorological echoes.

    The membership functions of that classifier were built from polarimetric observation campaigns in Oklahoma, Alabama, and other mid-latitude continental regions; T-Matrix electromagnetic simulations; in-situ measurements; and expert microphysical knowledge. That is: rigorous physics, but physics of mid-latitude continents.

    3.2 Vaisala and HydroClass

    Colombia operates Vaisala radars, mainly WRM200 in C-band. Vaisala incorporates a module called HydroClass™, and explicitly states that it uses «a proven fuzzy logic algorithm» to classify meteorological and non-meteorological targets (Vaisala, 2021).

    The classes it identifies are:

    • Rain
    • Hail
    • Graupel
    • Snow
    • Wet snow
    • Non-meteorological targets (insects, birds, sea clutter, wind turbines, military chaff, interference)

    And the variables feeding the classifier are:

    • ZDR
    • RhoHV
    • PhiDP
    • KDP
    • LDR (when operating in that mode)

    3.3 The Key Point: A Shared Philosophy

    Notice something. Neither of them trains with massive historical datasets. Neither uses modern machine learning. Both follow the same recipe:

    • Physical simulation of hydrometeors (T-Matrix)
    • Construction of characteristic regions in polarimetric space
    • Classification via fuzzy logic
    • Correction using ambient temperature

    They’re cousins. They share physics, share method, share limitations. And they share the same problem when they land in the tropics: neither was built with the 0 °C isotherm at 5 km in mind.

    That means the bias doesn’t come from «bad training data.» It comes from something deeper: the campaigns, the measurements, and the expert knowledge are from one place. The T-Matrix simulates particles, but the particles it simulates are the ones someone decided to simulate. The campaigns were done in Oklahoma, in Darwin, in Helsinki. The expert knowledge is expert in something.

    The classifier isn’t «poorly trained.» It’s trained for another place. And that’s harder to fix than retraining with data.

    4. Tropical Physics Is Not Mid-Latitude Physics

    There’s an important nuance here that my reader should keep in mind: the symptom changes depending on the radar’s operating band, but the disease is the same.

    4.1 The Case of Jamaica (S-band)

    S-band has a huge advantage: rain attenuation is much lower than in C- or X-band. That means the problem isn’t attenuation. The problem is something else.

    The 0 °C isotherm sits at 5 km. In mid-latitudes it sits at 2–3 km. A Jamaican radar can be sampling ice at 4 km altitude — ice that melts before reaching the ground. The classifier sees ice and says «snow.» The pilot reports rain. Both are right; the HID doesn’t distinguish between «there’s ice in the sampling volume» and «snow is falling at the surface.»

    Warm microphysics dominates. Zipser et al. (2006) documented why maritime tropical convection — such as the Caribbean’s — exhibits warm microphysics signatures: efficient coalescence, high liquid water content, small-to-medium drops that rarely reach the freezing point at low levels. Unlike mid-latitude continental storms, where updrafts generate large ice structures, here rain is produced without the need for an extensive ice phase.

    This translates into moderate reflectivities with high KDP. And the traditional boundaries of the classifier fail: they associate those reflectivity levels with ice mixtures, when in reality it’s efficient warm rain.
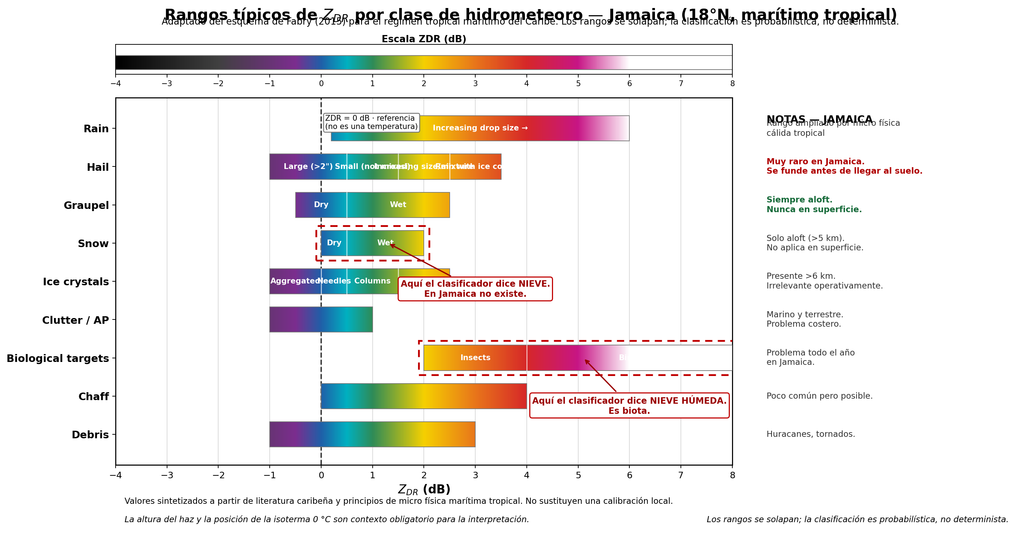
    Figure 1. Typical ZDR ranges by hydrometeor class for Jamaica (18°N, maritime tropical). Adapted from Fabry’s (2015) scheme. Each horizontal bar represents the ZDR range associated with a category, colored according to a continuous chromatic scale. The ranges deliberately overlap to reflect the inherent ambiguity of polarimetric classification; class assignment is probabilistic, not deterministic. Note the absence of an operational «dry snow» region at the surface — the Snow bar corresponds exclusively to ice aloft that melts before reaching the ground — and the unusually wide Rain range, a consequence of tropical warm microphysics. The two dotted boxes highlight the most frequent confusions of the imported classifier: the Snow category, which in Jamaica corresponds to graupel aloft and not surface snow, and the Biological targets category, which the HCA erroneously labels as «wet snow» when in reality it’s biota. The dashed vertical line at ZDR = 0 marks the boundary between spherical and oblate particles, not a temperature; the 0 °C isotherm, which in Jamaica sits around 5 km altitude, must be consulted separately via soundings or vertical profiles.

    The ambiguity between big drops and melting hail. In S-band the Mie effect is smaller than in C-band, but it doesn’t disappear. Large drops and melting hail can occupy neighboring regions of polarimetric space. The NSSL/Ryzhkov classifier, tuned with continental microphysics, tends to lean toward ice.

    Biota is a year-round problem. Warm marine boundary layer, insects, birds. High ZDR with low RhoHV. The classifier says «wet snow.» It’s not snow: it’s life.

    4.2 The Case of Colombia (C-band)

    Here another problem is added: severe differential attenuation.

    In C-band, intense tropical storms absorb and scatter energy asymmetrically between the H and V channels. If a rigorous correction based on KDP is not applied, Zh and ZDR drop artificially behind the convective core. And there the classifier goes haywire: it labels heavy rain as dry snow, melting hail, or total attenuation (Bringi & Chandrasekar, 2001; Vaisala, 2021).

    4.3 The Lesson

    Same classifier, same assumptions, same bias. But:

    • In Jamaica (S-band), the problem is the high isotherm and warm microphysics.
    • In Colombia (C-band), differential attenuation is added.

    Same disease, different symptoms.

    5. The Colombian Case: Two Manufacturers, One Challenge

    Colombia offers a particularly rich case study, because at least two manufacturers with different classification philosophies coexist in its territory, both operating in C-band and both in a tropical regime.

    5.1 SIATA (Medellín): EEC in C-band, Locally Adapted

    The Early Warning System of Medellín and the Aburrá Valley operates a polarimetric EEC radar in C-band — the same manufacturer that supplies Jamaica’s radar — in complex topography and tropical Andean convection. This means it faces two simultaneous problems: tropical warm microphysics (high isotherm, large drops, graupel aloft) and the severe differential attenuation characteristic of C-band.

    The SIATA team has developed local classification models by adapting traditional fuzzy logic, with KDP-based attenuation correction before feeding the membership vector (SIATA, 2020; Hoyos et al., 2016). Validation combines the dense Parsivel disdrometer network with lightning detection sensors and profiling radars.

    The SIATA case is valuable for two reasons. First, because it demonstrates that it can be done well in tropical C-band, with the right instruments. Second, because it’s the same manufacturer as Jamaica, allowing a direct comparison: both are EEC, both use NSSL-HCA derivatives, but SIATA has been locally adapted while there is no public evidence that Jamaica has done the same.

    5.2 Aerocivil (Colombia): Vaisala in C-band

    Colombia’s Civil Aviation Authority operates Vaisala WRM200 radars in C-band. This is the case that originated this article: Vaisala’s HydroClass classifier reporting snow in warm regions where pilots report rain. A Finnish classifier, applied to a Colombian sky.

    5.3 The Question That Arises on Its Own

    If SIATA (EEC, C-band) has been locally adapted and Aerocivil (Vaisala, C-band) reports the classic symptom of regional bias, then the question isn’t «which manufacturer is better?» The question is: how many radars in the tropics are operating with classifiers that were never locally validated?

    6. It’s Not an Anecdote. It’s a Documented Pattern

    What my colleague saw in Colombia isn’t a rarity. It’s documented throughout the region and beyond.

    Puerto Rico (NEXRAD TJUA, S-band). Research from the University of Puerto Rico at Mayagüez and collaborators has analyzed the response of the official NOAA HCA during hurricanes and tropical cyclones. Key finding: in pure tropical systems dominated by warm microphysics, the classifier erroneously labels torrential rain zones with moderate Zh and high KDP as «rain and hail mixture.» Adjustments have been proposed to raise ZDR and KDP thresholds in detecting very heavy rain.

    Guadeloupe and Martinique (Météo-France, C-band). Cross-validation campaigns with TRMM and GPM have allowed calibration of the melting layer height — 4.5 to 5.0 km in the Caribbean — and adjustment of membership functions to avoid false «wet snow» classification at mid-levels.

    Colombia (SIATA, C-band). The case already described. Local classification models adapting fuzzy logic, with multi-instrument validation (SIATA, 2020; Hoyos et al., 2016).

    Colombia (Universidad Distrital, C-band). The book by Camargo-Camargo, Cadena-Contreras & Alejo-Zabala (2022) documents how factory-default models in commercial radars, designed for mid-latitudes, overestimate the presence of ice and make errors in the melting zone. Señalin’s (2021) thesis develops a classification model specifically adapted to the warm microphysical dynamics of low latitudes.

    India (CAIPEEX / IITM). The CAIPEEX campaign of the Indian Institute of Tropical Meteorology used dual-polarization radars in X- and C-band combined with Parsivel and 2DVD optical disdrometer networks, plus airborne instrumentation. They evaluated fuzzy logic membership functions adjusted to monsoon drop size distribution versus the standard S-band matrices set for mid-latitudes.

    Australia (Darwin, C-POL). Thompson et al. developed a 10-category HCA in C-band optimized for tropical environments. Their explicit motivation was the electromagnetic ambiguity between big drops/melting hail and wet snow caused by Mie effects in C-band — exactly the kind of confusion a mid-latitude classifier doesn’t resolve.

    The pattern is clear: everywhere an imported classifier has been validated in the tropics, the same bias has been found. It’s not a problem of a poorly calibrated radar. It’s a structural problem.

    7. How to Do It Right: The Recipe

    If the problem is structural, so is the solution. It’s not about throwing away the classifier. It’s about domesticating it.

    7.1 Multi-Instrument In-Situ Validation

    The most robust scheme, pioneered by SIATA in Colombia, combines three components:

    • Polarimetric radar: continuous spatial coverage, key variables (Zh, ZDR, RhoHV, PhiDP).
    • Optical disdrometer network (Parsivel, 2DVD): directly measures drop size distribution (DSD) and fall velocity at the surface. Validates the radar’s microphysical assumptions.
    • Altitude soundings: determine the atmosphere’s thermal structure and the height of the 0 °C isotherm. Crucial data for constraining classification models.

    7.2 Attenuation Correction with KDP

    In C- and X-band, differential attenuation correction based on KDP is mandatory before feeding the classifier’s membership vector. Without it, false classifications downstream of the convective core are inevitable. This applies both to Colombia’s Vaisala WRM200 radars and to SIATA in Medellín, both in C-band.

    7.3 Re-Adjusting Membership Functions with Local DSD

    Work by UNAM in Yucatán, Universidad Distrital in Colombia, and CAIPEEX in India all agree: the HCA’s beta membership functions must be built with electromagnetic scattering data (T-Matrix) fed with local DSDs. Not with the standard NEXRAD or European matrices.

    7.4 Introducing Temperature and Height as Context Variables

    The classifier should know at what altitude it’s measuring. A pixel at 5 km in Jamaica is not the same as a pixel at 5 km in Finland. If the HID doesn’t incorporate the height of the 0 °C isotherm, it’s doomed to be wrong.

    7.5 Cross-Validation with Spaceborne Remote Sensors

    Cross-referencing the 3D classification from the ground radar with the GPM DPR or TRMM PR classification allows confirmation of the vertical structure of the melting layer and graupel cores over sea and land in the tropics (Dolan & Rutledge, 2009, 2011).

    7.6 Transparency and Quality Flags

    A good operational HID should indicate uncertainty per class, include an «unknown class» or «low confidence» label, avoid forcing a classification when variables aren’t conclusive, and document which region it was trained for and what its limitations are.

    8. Beyond the HID: The Microburst Opportunity

    And this is where the article stops being a critique and becomes a proposal.

    Because the hydrometeor classifier is not the final product. It’s an input. And for certain applications — microburst detection, severe convection nowcasting, early warning — the traditional HID falls short, not because it’s wrong, but because it wasn’t designed for that.

    For microburst detection, the real value lies in combining:

    • Predominant hydrometeor (HID output)
    • ZDR column (updraft signature with big drops)
    • KDP column (liquid water content)
    • Doppler divergence (surface wind signature)
    • Maximum reflectivity descent (downburst signature)
    • Height of the graupel and hail region (charging mechanism)
    • Thermodynamic profile (stability, CAPE, condensation level)

    Traditional HIDs aren’t designed for this. They’re designed to say «this is rain» or «this is hail.» But a modern microburst nowcasting system could use HID outputs as one more variable within a broader scheme.

    There’s a concrete opportunity here. With an S-band polarimetric radar like Jamaica’s — 8.5 m antenna, narrow beam, good resolution — one can develop a microburst risk classifier that:

    • Uses the HID (or HydroClass, or NSSL-HCA) as an input, not as a final product.
    • Incorporates ZDR and KDP columns as updraft detectors.
    • Combines with low-level Doppler divergence.
    • Constrains with local thermodynamic profile (0 °C isotherm at 5 km, CAPE, etc.).
    • Validates with surface reports and the LLWAS network if one exists.

    That would be more modern than traditional HCAs. And it would be a real contribution, not just a complaint.

    9. Conclusions

    Calibrating (instrumentally) ZDR and PhiDP is essential. But it’s not enough. The HID is a regional model disguised as a universal product. And in tropical, Andean, or simply different regions, that disguise falls apart.

    My colleague’s anecdote at Aerocivil isn’t a rarity. It’s a symptom. It’s what happens when we import technology without importing context. When we believe that an algorithm trained in Helsinki or Enterprise, Alabama, can tell us what’s falling from the sky over the Magdalena Medio. Let my reader not believe that a radar manufacturer can develop costly field experiments in the country where it’s going to install the radar. They take results published by universities and research centers that do these studies … valid only for the places where those studies are done.

    The solution isn’t to throw away the classifier. It’s to domesticate it: validate it with disdrometers, re-adjust its membership functions with local DSDs, introduce temperature and beam height as context, correct attenuation with KDP, and above all, know when not to believe it.

    And then take the next step: use the HID for what it is — an input — and build on top of it systems that answer more useful questions: Is there going to be a microburst? Is it going to hail? Is it going to rain hard enough to flood the valley?

    Because in the end, the HID isn’t a truth. It’s a trained opinion. And like any opinion, you need to know where it comes from.

    References

    Bringi, V. N., & Chandrasekar, V. (2001). Polarimetric Doppler Weather Radar: Principles and Applications. Cambridge University Press.

    Camargo-Camargo, J. E., Cadena-Contreras, L. A., & Alejo-Zabala, G. (2022). Estudio de hidrometeoros basado en información de variables polarimétricas de radares meteorológicos para Colombia. Editorial Universidad Distrital Francisco José de Caldas.

    Dolan, B., & Rutledge, S. A. (2009). A theory-based hydrometeor identification algorithm for X-band polarimetric radars. Journal of Atmospheric and Oceanic Technology, 26(10), 2071–2088.

    Dolan, B., & Rutledge, S. A. (2011). A theory-based hydrometeor identification algorithm for X-band polarimetric radars. Journal of Atmospheric and Oceanic Technology, 28(5), 621–637.

    Doviak, R. J., & Zrnić, D. S. (1993). Doppler Radar and Weather Observations (2nd ed.). Academic Press.

    Hoyos, C. D., Ceballos, L. I., Pérez, J. S., & Sepúlveda, J. I. (2016). The hydrometeorological monitoring network of the Aburrá Valley (SIATA): An integrated approach for early warning systems. Proceedings of the American Meteorological Society.

    Michaelides, S. (Ed.). (2019). Precipitation Science: Measurement, Remote Sensing, Research and Applications. Elsevier.

    Ryzhkov, A. V., & Zrnić, D. S. (2019). Radar Polarimetry for Weather Observations. Springer.

    Señalin, M. A. (2021). Modelo de clasificación de hidrometeoros para zonas ecuatoriales. Repositorio de la Biblioteca Digital de Bogotá.

    SIATA. (2020). Radares meteorológicos: Equipamiento, procesamiento de señales y variables polarimétricas. Documentación técnica del proyecto, Área Metropolitana del Valle de Aburrá.

    Thompson, E. J., Rutledge, S. A., Dolan, B., Chandrasekar, V., & Cheong, B. L. (2014). A dual-polarization radar hydrometeor identification algorithm for X-band. Journal of Atmospheric and Oceanic Technology, 31(12), 2611–2627.

    Thompson, E. J., et al. A Robust C-Band Hydrometeor Identification Algorithm and Its Application to Long-Term C-POL Observations in Darwin, Australia. Journal of Applied Meteorology and Climatology.

    Vaisala. (2021). Corrección de atenuación de radares meteorológicos banda-C. Nota de aplicación técnica, Vaisala Oyj.

    Zipser, E. J., Cecil, D. J., Liu, C., Nesbitt, S. W., & Yorty, D. P. (2006). Where are the most intense thunderstorms on Earth? Bulletin of the American Meteorological Society, 87(8), 1057–1072.

    Author’s Note

    This article is a divulgative review based on published literature, manufacturer technical documentation, and field observations in Colombia and the Caribbean. Statements about EEC’s classifier and its NSSL lineage are based on public technical documentation and reasonable inferences, not official communications from the manufacturer. Any reader with first-hand information is invited to contribute to the discussion.
  • An Unusual Proposal of Cuban Zarzuela for Caribbean Radars

    An Unusual Proposal of Cuban Zarzuela for Caribbean Radars

    A post to talk about the possible integration of weather radars in the Caribbean. Versión en español aquí.

    The Cuban zarzuela is neither opera nor comedy. It is a form of lyric theatre in which instrumental and sung music intertwines with spoken passages, and in which characters of different registers —soprano, tenor, baritone, chorus— do not sing the same thing, yet converge on a single story. Cuba is the only country in Spanish America where the genre acquired fully national character: Lecuona, Roig, Prats knew how to fold Cuban rhythm and phrasing into a polyphonic structure, and out of that came works that are at once universal theatre and a portrait of this island.

    That is, precisely, the situation of the radars of the Caribbean and the Gulf of Mexico. Each radar is a voice in the score: a different manufacturer, a different wavelength, a different scanning capability. No single one of them sees the whole work. And yet, when the hurricane comes toward us, all of them ought to be singing together. Let me speak plainly, because I have been turning this over for days and can find no way to say it without bluntness: we have an orchestra that has not finished tuning.

    The metaphor is not new. It dates to 2014. In May of that year, at a workshop in Bogotá, I heard Dr. Asko Huuskonen speak about the OPERA programme and its successes in spite of the diversity of technologies, scanning strategies and very different operating regimes. It occurred to me then that we, in the Caribbean, Central America and the north of South America, might manage if not an «Opera» then at least a «Zarzuela.» I wrote it on this blog and left it there, like a bottle thrown into the sea, sealed with a «perhaps someday we will manage it» that sounded more like a farewell than a forecast.

    Twelve years later, the bottle has come back to shore. And it comes back with something it did not have then: an open-source conductor, capable of making voices sing together that do not even know one another. I still have no one to send it to. So I am publishing it again. If anyone at the WMO, at the CMO, or at any meteorological service in the basin reads this, let them know it is not an idea fresh off the stove: it is an idea that has been afloat for twelve years.

    What we have: an orchestra of disparate voices

    The radar network of our basin is not homogeneous, and it is worth saying so without euphemism. Three manufacturers dominate.

    Leonardo Germany, heir to Gematronik and Selex, is the majority supplier to the network of the Caribbean Meteorological Organization. Its S-band Doppler radars equip Barbados, Belize, Guyana, Trinidad, the Cayman Islands, Guadeloupe and Martinique. Barbados carried out an upgrade to dual polarisation that allows it to distinguish hydrometeor types and improve rainfall estimation.

    EEC supplied Jamaica’s Defender S850 radar —an S-band Doppler with dual polarisation that replaced an older-generation Doppler— as well as radars to Mexico and French Guiana.

    Vaisala is present in the non-CMO insular Caribbean. The Dominican Republic operates a national network with Vaisala technology, including the solid-state WRS300 model; Curaçao operates a WRM 200; and San Andrés, in the Colombian Caribbean, also operates Vaisala equipment.

    To these we must add the Cuban radars, which are a case apart. Cuba operates eight radars: four Electromash MRL-5 units of Soviet origin, three Mitsubishi RC-32B units of Japanese origin, and one modern German SELEX METEOR-1500S, all modernised through the Centre for Radar’s own development. Three of them, the RC-32Bs, are the oldest extreme of the orchestra: radars from 1973 that are still operating. At the other extreme, the Jamaican radar is the most recent in the region. Between the two, a range of intermediate states: units not yet Doppler, conventional Doppler, and Doppler polarimetric.

    As for wavelengths, most operate in S-band, the natural choice for the Caribbean because attenuation by heavy rain is lower than in C or X. Some Mexican and Dominican radars operate in C-band, and there are X-band installations in Tobago and Saint Lucia, with reduced range but high spatial resolution.

    Capabilities are not uniform either. There are non-Doppler, Doppler and dual-pol Doppler. That gradation is not a defect; it is reality. And it is exactly what makes integration a genuine technical problem rather than an armchair whim — made harder still by the fact that each radar scans with its own strategy, its own cycle, its own rhythm.

    The mosaic that already exists, and what it does not give us

    The mosaic produced by the Barbados Meteorological Service is, today, the most advanced attempt to make these voices sing together. Every fifteen minutes, that mosaic integrates data from multiple sources. In its early days it drew on nine regional radars; today it has grown to include radars from Tobago, Saint Lucia, the Dominican Republic and Cuba, reaching a maximum of eighteen contributors, including radars from Miami, Colombia and Suriname.

    Its importance is not merely visual. The National Hurricane Center in Miami uses it, and NOAA has shown interest in assimilating these data into a high-resolution numerical prediction model for the Caribbean. In other words: the zarzuela is already being heard by the great orchestras of forecasting.

    But there is a structural limit worth facing squarely. That mosaic exchanges already-processed images —CAPPI products in BUFR format, sometimes netCDF— not raw volumes of reflectivity and radial velocity. The coordination is therefore superficial: the visual result is shared, not the analytical raw material. Latency between radars is unavoidable, quality is heterogeneous, and assimilation into numerical models remains limited to what the image allows. We share the finished painting, not the pigments.

    And there is no small detail: that mosaic is not the subject of any formal long-term arrangement. It is an initiative sustained by the goodwill of the Barbados meteorological service and by regional necessity. That is a great deal, and it deserves recognition. But it is not enough.

    The European precedent: OPERA

    There is no need to invent a format for cooperation. OPERA, the Operational Programme for the Exchange of weather Radar information, is the weather radar programme of EUMETNET, the network of European meteorological services. It was born in 1999 with a simple and ambitious mandate: to harmonise and improve the operational exchange of radar information among national services.

    Before OPERA, exchange was bilateral and chaotic. Each country used its own format, developed for a specific installation, and communication links were dedicated and fragile. The COST 72 project ended up using four different formats for a single data exchange pilot alone.

    OPERA’s solution was twofold. First, to develop a common information model, ODIM, which sets strict rules for encoding radar data and their metadata in standard formats. Second, to build a centralised data hub —the Odyssey Data Centre— that collects raw volume data from member radars and performs quality control centrally.

    The advantages are precisely the ones we need. It extends the national network at no additional cost, produces operational pan-European mosaics —more than 160 radars from 30 countries feed a reflectivity mosaic updated every five minutes at one-kilometre resolution— and demonstrates that harmonisation is possible without homogenising the equipment. OPERA has succeeded in spite of the diversity of technologies, scanning strategies and calibration methods.

    The difference is that Europe built its own standard. We do not need to invent anything: we can adopt one that already exists and is proven. NEXRAD Level 2, the standard of the US network, converted from each radar’s native data.

    LAMULA™ ORPG: the conductor that does not care about the manufacturer

    LAMULA™ ORPG is a free and open implementation of the NEXRAD Open Radar Product Generator, developed by LADETEC in Cuba. Its function is the secondary processing of raw data from any conventional weather radar, transforming volumetric information in the rough into visual and analytical products.

    Its key innovation is that it removes the dependence on polarimetric variables in the quality control module, which makes it compatible with non-polarimetric radars, conventional Doppler radars and modern polarimetric radars, regardless of manufacturer. It runs on free Linux and is open source. Each radar needs an ORPG instance; the database and web server can be shared across the whole network.

    In a market dominated by closed, proprietary ecosystems —Leonardo’s Rainbow, EEC’s EDGE, Vaisala’s IRIS— this returns the power of analysis to the local expert and removes the manufacturers’ black boxes. We are not asking anyone to change their radar. Not Barbados to abandon its Leonardo, nor Jamaica its EEC, nor Santo Domingo its Vaisala, nor Cuba its old Mitsubishi units from 1973. We ask only that we speak a common language at the end of the road.

    To this we add LAMULA™ WebViewer, which closes the cycle: processing, standardised products, mosaic generation and open-source visualisation, without a single proprietary licence in the chain.

    This is what did not exist in 2014: back then the Zarzuela was a metaphor without a score.

    The architecture, in three stages

    First stage: compressed transmission. Today, Cuba’s eight radars transmit their primary data in the proprietary OBS format to two centres: Camagüey as the primary, Havana as a hot backup. That format, designed by LADETEC, carries numerous variables —among them the variance of power values— and is optimised for limited bandwidth conditions. The proposal is to extend the model: each radar in the basin transmits its primary data in an equally compact format —LAMULA™ OBS or its equivalent— to one or two regional centres. Barbados, with its dual-pol radar and its experience generating the mosaic, is a natural candidate for one of those nodes. A second centre could be located in Camagüey, creating a hot redundancy that guarantees operational continuity. Transmitting compressed raw data, rather than already-processed images, preserves the full volumetric information and makes assimilation into numerical models possible.

    Second stage: normalised processing. At each regional centre, one LAMULA™ ORPG instance would run per radar. The Barbados centre would have its own instance processing the Barbados radar data, another processing Trinidad’s, another Guyana’s, and so on. LAMULA™’s RDA_Back_End reads files in native format and translates them into the messages the NEXRAD ORPG requires. The result is that each radar, regardless of origin, produces Level 3 products in the NEXRAD standard: reflectivity, velocity, spectrum width, VIL, and where the hardware allows, polarimetric products. The diversity of voices has been translated into a common score.

    Third stage: standardised mosaic. From those Level 3 products, a mosaic generator would be fed that integrates not only reflectivity but also radial velocity, spectrum width and polarimetric variables where they exist. The mosaic ceases to be a visualisation tool and becomes a data source assimilable into numerical models. The National Hurricane Center could ingest not only reflectivity but also the wind fields derived from radial velocity, improving the initialisation of track and intensity models. This is exactly the model OPERA validated in Europe: its data centre ingests raw volumes, not images, and produces mosaics from them.

    What this proposal solves, and what it does not

    It solves the interoperability of raw data, because today images are exchanged and not complete volumes. It solves dependence on a single manufacturer, because an open-source ORPG breaks technological lock-in. It solves assimilation into regional models, because the NHC and forecasting centres could ingest Level 2 data from the entire basin, not only from US radars. And it solves real integration, not merely visual: I am not proposing a prettier mosaic, but a network in which every voice contributes normalised raw data.

    It does not solve hardware calibration. A miscalibrated radar keeps sending miscalibrated data, even in NEXRAD format. It does not solve physical maintenance: some CMO radars are more than a decade old and may require replacement of certain components. It does not solve connectivity: if a radar has no stable link, no software can ingest what does not arrive. And it does not solve political will or financing. Adopting a common standard implies multilateral agreements, integration budgets and training. The software is free; the engineering and the diplomacy are not.

    Closing: from zarzuela to symphony

    A zarzuela does not require every character to have the same register; it requires a common libretto and a conductor who knows when each voice enters. The Caribbean radar network already has the libretto —the Barbados mosaic— and already has the voices. What is missing is the shared score that turns disparate images into assimilable data, and that allows the forecast of a hurricane approaching Barbados to benefit from what Trinidad’s radar saw, from what Cuba’s saw, and from what Jamaica’s will see as the system continues on its path.

    Twelve years ago I closed that entry with a «perhaps someday we will manage it.» Today I would rather close this one with a question: if the software already exists, if the European precedent is already proven, if the infrastructure is already in place and if the mosaic is already generated every fifteen minutes, what exactly are we missing?

    Hurricanes do not ask for a passport or a visa to cross our waters. It seems to me an elementary matter of justice that our data should not ask for one either.

    If anyone at the WMO, at the CMO, or at any meteorological service in the basin reads this and finds it reasonable, let them say so. This bottle has been at sea for twelve years. It is high time someone opened it. —Or so I say.


  • Uncalibrated Weather Radars: Are We Measuring Blind?

    Uncalibrated Weather Radars: Are We Measuring Blind?

    Discover why calibrating weather radars (WMO-No. 1257) is essential to move from qualitative images to real quantitative data in storm monitoring and precipitation estimation. Sharing uncalibrated radar data is like counting guavas and apples as if they were one and the same set. Versión en español aquí.

    (más…)
  • Acquiring and Planning Radar Spare Parts: From Theory to the Incredible Cuban Experience

    Acquiring and Planning Radar Spare Parts: From Theory to the Incredible Cuban Experience

    Versión en español aqui.

    If you are someone involved in the purchase or donation of a weather radar for a “developing” country—a very sugar-coated and euphemistic way of not saying underdeveloped—allow me to “stick my spoon in” (a Cuban saying for expressing an opinion nobody asked me for): the decisive question is not how many radars and of what types can be bought to help that country’s meteorology, but what that country will be able to keep running when the warranty expires, the supplier stops responding, the spare part does not arrive on time, the manufacturer becomes unreachable, and the budget has shrunk to a fraction of what was planned.

    I do not speak about this from abstract theory, nor from a manual, nor from a conference room. I speak from forty-five years of work with radars on an archipelago that has been operating them for more than fifty years under a fierce blockade, without direct access to manufacturers, without the right to returns, and without even the possibility of asking technical questions about the spare parts that must be bought through tortuous channels—and with the obligation to get it right on the first try because there is no money for a second purchase. Here we have not learned to buy spare parts: we have learned to take each module apart in order to redesign it and build it from other components, and to keep a well-established list of options—from A to Z—to rebuild the functionality of any radar module that breaks down.

    If someone is going to advise an underdeveloped country—let us set euphemisms aside, since we all know that the gap between developed and non-developed countries does nothing but widen—on acquiring technology that will have to work in that country’s real conditions, not ideal ones, I suggest looking at the Cuban experience: that of a kind of world champion in sustainability under very adverse conditions. I am not boasting; it is just that some questions can only be answered from the scars of a survivor of many battles.

    (más…)
  • Where Should a Weather Radar Be Located for General Meteorological Service?

    Where Should a Weather Radar Be Located for General Meteorological Service?

    If in the previous article I addressed the siting of a radar to serve an airport, now I want to broaden the range and talk about the siting of a weather radar for general meteorological service. The fundamental difference is that, while in the airport case the goal is to detect hazardous phenomena during takeoff and landing—wind shear, microbursts, gust fronts—in general meteorological service the goal is continuous surveillance of the atmosphere over a broad territory: precipitation, severe storms, tropical cyclones, hail, and in general all phenomena that affect the population and the economy.

    I have been involved in the siting and installation of several radars throughout my life. And if I have learned anything, it is that the order of the factors does alter the product. In my experience, one must begin with logistically accessible sites. Starting by looking for locations on very high peaks with panoramic views is pointless if they later turn out to be places where logistics—roads, redundant communications, electric power—would be prohibitively expensive or impossible to sustain. Once you have logistically plausible sites, then you review visibility with DEM/LOS models and decide how to complement with other radars and of what type. And above all, the operating band, which is what decides the price.

    Allow me to share what I have gathered on these criteria, in a manner analogous to what I did for the airport case.

    (más…)
  • Where Should a Weather Radar Be Located to Serve an Airport?

    Where Should a Weather Radar Be Located to Serve an Airport?

    Post about optimal sitting of a weather radar to serve airport. Spanish version here.

    I have been involved in the siting of several radars in my life. It all began with the MRL-5 radar, the first of its type to enter Cuba, with which we began our working life together. Although I was already a certified expert on MRL-5 radars, in 1986 the Casa Blanca one was installed, at the headquarters of the Institute of Meteorology itself; but I had no involvement in selecting the site. For a long time it was debated whether the Camagüey radar, which was at the Meteorological Center, should be raised by making a small hill right there or by constructing a small structure to elevate it; but it was not until 1997 that it was reinstalled in a fully automatic version (MRL-5M) at Loma de la Mula. In 2005 I took part in selecting the location and installation of the METEOR-1500S radar at Loma El Paraíso in Holguín. Seven years later, in 2012, we moved the Camagüey radar back to the Meteorological Center, turning it into the RD-200SX Radar, prototype of the Cuban Doppler Weather Radar. Finally, I was involved in installing the METEOR-735C radar in Las Nubes, Nicaragua. In none of the cases was an optimal installation with respect to an airport sought; decisions were made on purely logistical criteria. Nevertheless, over the years I collected everything related to selecting the site of a weather radar (especially Doppler radars) to provide services to an airport for detecting meteorological phenomena that generate adverse factors for air navigation. If my indulgent reader allows, I will share these criteria.

    ICAO or WMO may have written suggestions on the location of a weather radar to serve an airport; but I have not found them. Everything I have been able to collect comes from the U.S. Federal Aviation Administration (FAA) and here I present it. Let us begin with some essential definitions.

    (más…)
  • Oriente Medio: 40. Caravana, una propuesta de LADETEC para la integración de radares en la región

    Oriente Medio: 40. Caravana, una propuesta de LADETEC para la integración de radares en la región

    En la vigilancia meteorológica global, dos redes de radares destacan como faros: la NEXRAD estadounidense y el programa OPERA europeo. Una apostó por la homogeneidad centralizada escalando ininterrumpidamente la calidad tecnológica; la otra, por la interoperabilidad voluntaria entre naciones con equipos dispares; pero estándares bien establecidos. Ambas demostraron algo esencial: la cooperación técnica salva vidas.

    Oriente Medio, una región acostumbrada a las tormentas de polvo, las lluvias torrenciales que desbordan wadis y los medicanes en el Mediterráneo oriental, sufre hoy una cobertura de radares fragmentada y muy desigual. Cada país mira su propio cielo, pero las nubes no respetan fronteras políticas, étnicas o ideológicas. Cuando una tormenta se gesta sobre Irak o el norte de Arabia Saudí y avanza hacia Kuwait o Irán, las alertas llegan tarde.

    Las trágicas inundaciones de abril de 2024 fueron un claro recordatorio de esta vulnerabilidad. Países como Emiratos Árabes Unidos, Omán e Irán sufrieron lluvias torrenciales que dejaron devastación a su paso: 46 personas perdieron la vida, la actividad en el aeropuerto internacional de Dubái quedó paralizada y las carreteras se convirtieron en ríos de lodo. Fue un fenómeno extremo que no conoció fronteras y que demostró que la próxima tormenta podría golpear a varios países a la vez. Es entonces cuando surge la pregunta crucial: ¿estamos preparados para avisar con tiempo a quienes están en su camino?

    (más…)
  • Once upon a time…Japanese Radars, the beginning of a new era in Cuban Meteorology

    Once upon a time…Japanese Radars, the beginning of a new era in Cuban Meteorology

    Había una vez…Los Radares Japoneses, el inicio de una Nueva Era en la Meteorología Cubana.

    Toward the end of the sixties of the 20th Century, United Nation Development Program (UNDP), considering the frequency, intensity and destructive capabilities of hurricanes in the Caribbean Basin, evaluated and accepted a request from some countries belonging to the CARICOM, to supply equipment to arrange a “curtain of 10 cm weather radars” against hurricanes in the Caribbean together with radars in the French Departments of Lesser Antilles, Puerto Rico and Miami. At the same time, UNDP received an independent request through the World Meteorological Organization (WMO) from the Academy of Science of Cuba. UNDP-WMO, having a favorable financial situation, decided to complain with both requests. Hacia fines de la década de los sesenta del siglo XX, el Programa de las Naciones Unidas para el Desarrollo (PNUD), considerando la frecuencia, intensidad y capacidad destructiva de los huracanes en la cuenca del Caribe, evaluó y aceptó una solicitud de algunos países pertenecientes a CARICOM, para suministrar equipos disponer una “cortina de radares meteorológicos de 10 cm” contra huracanes en el Caribe junto con radares en los departamentos franceses de las Antillas Menores, Puerto Rico y Miami. Al mismo tiempo, el PNUD recibió una solicitud independiente a través de la Organización Meteorológica Mundial (OMM) de la Academia de Ciencias de Cuba. El PNUD-OMM, teniendo una situación financiera favorable, decidió cumplir con ambas solicitudes.

    (más…)