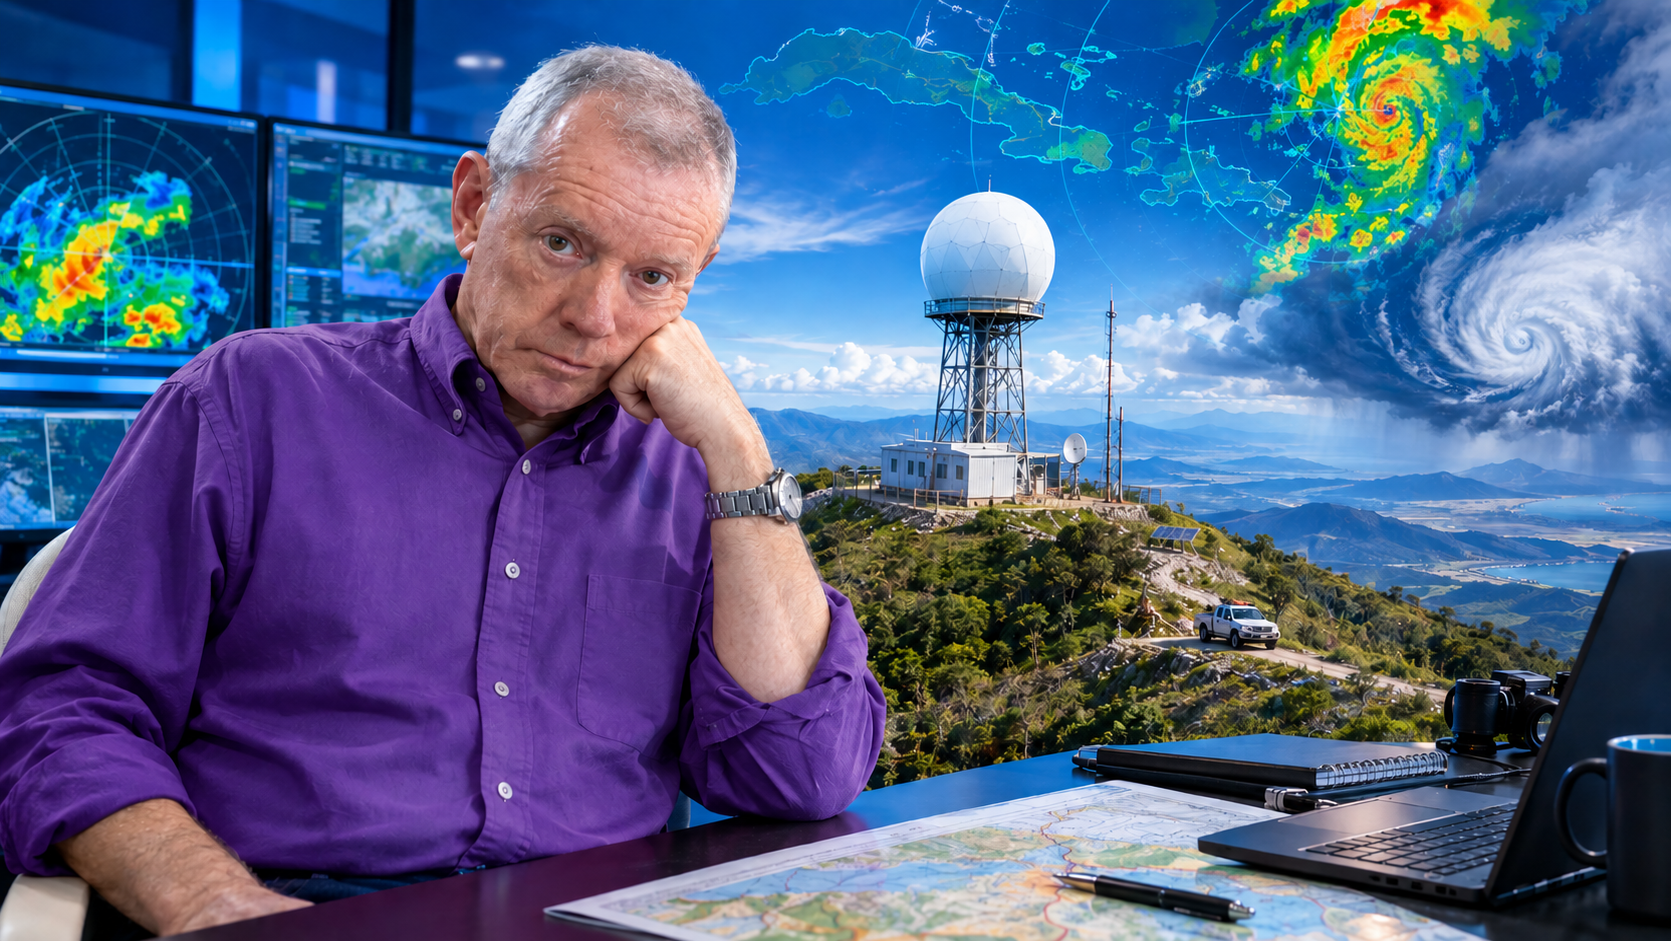
If in the previous article I addressed the siting of a radar to serve an airport, now I want to broaden the range and talk about the siting of a weather radar for general meteorological service. The fundamental difference is that, while in the airport case the goal is to detect hazardous phenomena during takeoff and landing—wind shear, microbursts, gust fronts—in general meteorological service the goal is continuous surveillance of the atmosphere over a broad territory: precipitation, severe storms, tropical cyclones, hail, and in general all phenomena that affect the population and the economy.
I have been involved in the siting and installation of several radars throughout my life. And if I have learned anything, it is that the order of the factors does alter the product. In my experience, one must begin with logistically accessible sites. Starting by looking for locations on very high peaks with panoramic views is pointless if they later turn out to be places where logistics—roads, redundant communications, electric power—would be prohibitively expensive or impossible to sustain. Once you have logistically plausible sites, then you review visibility with DEM/LOS models and decide how to complement with other radars and of what type. And above all, the operating band, which is what decides the price.
Allow me to share what I have gathered on these criteria, in a manner analogous to what I did for the airport case.
Logistics first: the criterion that cannot be ignored
The World Meteorological Organization (WMO) says it clearly in its best-practice guides: the choice of a radar site depends on the intended application, but it is also influenced by many economic and technical factors. Among them are the existence of roads to reach the radar, the availability of power and telecommunications links, the cost of land, proximity to a monitoring and maintenance facility, and the existence of the fewest possible obstacles to the radar beam.
Practical experience confirms this. In a recent project in the Biobío region of Chile, the ArcGIS Model Builder platform was used to obtain candidate zones for installing a weather radar based on parameters such as elevation, topographic position index, average visibility distance, proximity to roads, and power lines. That is, logistics is not a last-minute addition: it is a first-order criterion in site selection.
In a real case in Sichuan Province, China, site-selection teams had to go into mountains where most of the preselected peaks had no road. The technicians cleared a path with machetes through the vegetation, recording coordinates and altitudes, and at each summit they evaluated the possibility of access to communications and electric power. As the mission leader said: «The radar is like a ‘celestial eye’; site selection is directly related to the accuracy and range of monitoring data for the next 15–20 years (or perhaps 50, like our three long-lived RC-32B radars—see the post Once upon a time…Japanese Radars, the beginning of a new era in Cuban Meteorology). One cannot be careless at all.»
This reminds me of an experience of my own. The monster Leonardo (Ichi) went to repair the METEOR-50DX weather radar (manufactured by GEMATRONIK-SELEX), on the grounds of Pasto airport, Colombia, and to access the radar one had to cross over the runway; therefore, one had to wait until there was no aircraft traffic on it. A site can have impeccable visibility and yet be a logistical hell. Look at the Karún radar in the middle of the Venezuelan jungle, with an enviable position and impractical logistics.
In Cuba we have three radars whose access can be critical and has had epic and memorable episodes: Gran Piedra (in Santiago de Cuba Province), Pico San Juan (in Cienfuegos Province), and Punta del Este (on the Isle of Youth). If you like, you can read about the feats of our LADETEC technicians to keep them running in what could be a Guinness record: Cuando no hay mulos se arrea a lomo de hombres, Expedición a la Isla del Tesoro.
The infrastructure requirements that the WMO details include tower, power supply (main and backup), lightning protection and grounding, and communications and network. This is not trivial. A site on a remote peak may require a tower tens of meters high, a solar or wind power system with a battery bank, a lightning rod carefully designed not to affect antenna performance, and a VSAT link to transmit the data. All of that multiplies the cost of operation and maintenance over the radar’s useful life.
Visibility analysis with DEM/LOS: when there are already logistically viable candidates
Once you have logistically plausible sites—with reasonable road access, available or installable power, and viable communications—then you proceed to visibility analysis. This is where Digital Elevation Models (DEM) and Line-of-Sight (LOS) analyses come in.
The WMO notes that, in the case of a radar network intended mainly for synoptic applications, radars in mid-latitudes should be located approximately 150 to 200 km apart. If the network is used for quantitative precipitation measurements, where low-altitude radar beams are essential, that distance should not exceed 100 km. But these numbers are only starting points: the actual visibility of the beam over the terrain is what determines effective coverage.
To evaluate that visibility, the fundamental tool is beam-blockage analysis using DEM. Tools developed by national meteorological services exist, such as that of the Turkish State Meteorological Service (TSMS), which uses a 30 m resolution digital elevation model and open-source libraries (wradlib) to calculate the beam blockage percentage, visible beam radius, visible beam percentage, minimum visibility height above mean sea level, and minimum visible angle for each point in the network. The process is iterative: successive elevation angles are tested until at least part of the beam is no longer blocked. LADETEC also has its own LAMULA™ DEM/LOS application.
In the Chilean case, once the logistically viable candidates were obtained, a Python code in ArcGIS was used which, based on the region’s digital elevation model and the control point, makes it possible to know the horizontal vision—the skyline—that the radar would have at that location. The requirement is that this vision have no topographic obstructions so as not to generate shadow zones. And once the skylines were traced, the directly benefited population was estimated. They discovered that a C-band radar with a range of 120 km would cover not only the Biobío region but also part of Ñuble and La Araucanía, benefiting more than 2 million inhabitants.
The WMO warns of something crucial: radar sites on high mountains are of little benefit for detecting precipitation near the ground. Measurements with negative elevation produce strong ground echoes, so they only make sense in exceptional cases. In mountainous regions, it is often impossible to achieve a balance between good visibility range and near-ground measurements. The solution suggested by the WMO is the auxiliary placement of smaller systems in large mountain valleys, which can play a valuable supplementary role. In Cuba we have the case of the Gran Piedra radar, a colossus that captures hurricanes north and south of Cuba better than the other 7 radars; but it cannot see precipitation in the city of Santiago de Cuba at its feet. Read these three posts to understand the dilemma of the Gran Piedra radar (Al César, lo que es del César, ¿Puede el radar de Gran Piedra «ver» la lluvia sobre la ciudad de Santiago de Cuba?, Radares cubanos vs Huracán Irma).
This connects directly with the next point.
Complementing with other radars: the network as a system
No radar is an island. The WMO says it bluntly: the selection of radar technology and network design will be influenced by current and future opportunities to access data from other radars. Weather radar networks are generally heterogeneous due to differences in age, vendors, technologies (S, C, and X bands), and function.
Radar spacing is a critical constraint. Spacing on the order of 150–200 km, as in Europe, versus 250–400 km, as in North America, significantly influences the choice of radar technology. If the application requires direct measurement at low altitudes for a limited area—for example, wind shear at an airport or in complex terrain—then only a short range (~40 km) is required, which also influences technology choice.
The modern trend is toward heterogeneous networks: S-band radars for broad coverage and detection of intense precipitation at long range, C-band radars as a compromise between range and cost, and X-band radars for gap-filling and short-range applications. A recent study showed that approximately one quarter of the potential gap-filling benefit could be achieved with only 25 additional «gap-filler» radars. The key is that lower-cost radars—X-band and C-band—operate at lower power and are available in significantly smaller configurations, making them ideal for complementing the coverage of an S-band network.
But complementation is not only a matter of bands. It is also a matter of scanning angles. A radar on an elevated peak may have excellent range at medium and high altitudes, but a blind spot near the ground. Another radar in a valley, with less range but better visibility of low layers, can complement that coverage. The WMO suggests that in mountainous regions, the auxiliary placement of smaller systems in large valleys can play a valuable supplementary role.
The operating band: the factor that decides the price
We come to the point that, in my experience, is most often underestimated at the planning stage: the choice of frequency band. The WMO summarizes it this way: the choice of frequency band results mainly from a compromise among range and reflectivity, which varies as λ⁻⁴; rain attenuation, which decreases as λ increases until it becomes negligible at decimeter wavelengths; data accuracy; and cost.
Let us look at the three main bands for weather radars:
S band (2700–2900 MHz, ~10 cm). This is the choice for detecting intense rain at very long distances, up to 300 km, in tropical and temperate climates. Rain attenuation is practically negligible, but the systems are bulky and expensive, require more powerful transmitters for sensitivity comparable to C band, and demand more space and more electricity.
C band (5600–5650 MHz, ~5.4 cm). It is generally preferred for use in temperate climates, since it represents a relevant compromise among the above parameters. It allows rain detection at long distances (up to 200 km), although its quantification is practically limited beyond 100 km. It offers the advantage of lower cost, both because of lower power and smaller antenna size compared with lower-frequency radars that have the same spatial resolution. The cost of C-band radars is approximately half that of S-band radars.
X band (9300–9500 MHz, ~2.5–3.2 cm). X-band radars are more sensitive and can detect smaller particles, but because they experience much greater attenuation, they are used only for very short-range weather observation, approximately 50 km. They are ideal for cloud-development studies, detection of light precipitation such as snow, and, because of their small size, as portable mobile units. Their cost is approximately one third that of an S-band radar.
The fundamental equation relating range and velocity in a Doppler radar is: Rmax · Vmax = c · λ / 8, where Rmax is the maximum unambiguous range, Vmax is the maximum unambiguous velocity, c is the speed of light, and λ is the wavelength. This means that a reduction in wavelength requires a reduction in effective range, in effective velocity-measurement capability, or a combination of both.
In practice, the modern trend is toward hybrid networks: a backbone of S- or C-band radars for broad coverage, complemented by X-band radars (much lower cost) for gap-filling, short-range applications, and high-resolution measurements in critical areas. In Cuba we have eight radars, of which three are Doppler (our own development with a long history: La Epopeya del Doppler Cubano: una historia en 13 capítulos), and the entire country is covered by a network that scans the troposphere every 10 minutes. I would never say «which band is best?» but rather «which combination of bands and what spacing satisfy the needs of my meteorological service with the available budget?» (¿Qué banda usar en los radares?).
An order of priorities
In summary, the process I recommend is as follows:
First, logistics. Identify sites with reasonable road access, availability or possibility of installing reliable electric power (with backup), and redundant communication options. Without this, any other consideration is academic. The WMO includes the existence of roads, the availability of power and telecommunications, and proximity to a maintenance facility as economic and technical factors influencing site choice.
Second, visibility. With logistically viable candidates, perform beam-blockage analysis with high-resolution DEM and LOS tools. Evaluate blockage percentage, minimum visibility height, and shadow zones. Prioritize sites that guarantee visibility over the areas of interest, not necessarily the highest peaks, because as the WMO warns, sites on high mountains are of little benefit for detecting precipitation near the ground.
Third, complementation. Design the network as a heterogeneous system. S- or C-band radars can provide the main coverage, while X-band radars can fill gaps and provide high resolution in critical areas. Radar spacing should be adjusted to the application: 150–200 km for synoptic applications, 100 km or less for quantitative precipitation measurements.
Fourth, the operating band. Band choice is ultimately an economic as well as a technical decision. S band offers the best performance for intense precipitation at long range, but it is the most expensive. C band is a reasonable compromise for temperate climates. X band is the cheapest and best suited for short-range applications and gap-filling. In a country like Cuba, with an already established network of eight radars and a tropical climate prone to cyclones, S band remains the backbone, but X-band radars could complement coverage in areas of specific interest. LADETEC has a design for a robust, sustainable X-band Doppler and polarimetric radar, made with Open Hardware and Open Software solutions that guarantee sovereign and long-lasting operation.
A final note
Radar manufacturers offer «seven versts to heaven,» as the Russian saying goes. They offer you wonder-radars. It is the phenomenon of post-truth applied to radar sales (La posverdad y los radares meteorológicos). All that glitters is not gold. If you are going to buy a radar for a meteorological service—or for any other application—seek the advice of an expert who has worked on the subject. It will be money well spent, because there is a lot of quackery being offered out there.
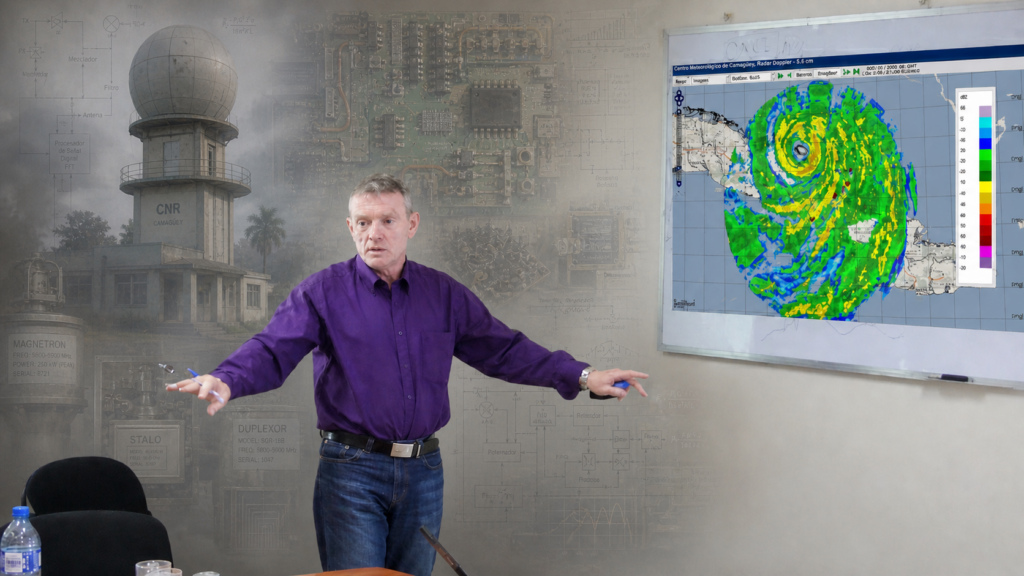
The WMO has an excellent guide, the Guide to Operational Weather Radar Best Practices (WMO-No. 1257), whose Volume IV is devoted precisely to Weather Radar Siting, Configuration and Scan Strategies. It is from 2024 and is available in the WMO library. If the reader wishes to go deeper, it is the obligatory starting point. And if the subject of aviation is of interest, you can consult the articles I mentioned in the previous post.
In the end, siting a weather radar for general meteorological service is not a problem of abstract mathematical optimization. It is a problem of practical engineering, where logistics, visibility, the radar’s main purpose (see the post on applications: ¿Cuáles son las Aplicaciones de los Radares Meteorológicos?), complementation (see how they complement in the United States: DE CASA a CLIMAVISION ¿Cómo rellenar los «huecos» en la cobertura de una red de radares?), and cost (look at these posts to get an idea not only of the initial investment but also of how much it costs to maintain them: Radares meteorológicos, costos and Los desafíos y los costos de mantener una red de radares meteorológicos) are interwoven in a balance that is never perfect. The important thing is not to start at the end. Starting with the highest and prettiest peaks may be poetic, but it is rarely sensible; the history of our Latin America collects more failures than successes (Radares Meteorológicos al Sur del Río Bravo: Un Mapa Desconcertante), and look at how many things influence coverage: ¿Cobertura del radar? Destrocemos un poco de mitos.
References
World Meteorological Organization (WMO). (2018). Siting and installation (Section 9). In Guide to Operational Weather Radar Best Practices, Part 1. Geneva: WMO. https://old.wmo.int/extranet/pages/prog/www/IMOP/ISO/Std_Radar_Part1_For_Members_Review.pdf
World Meteorological Organization (WMO). (2024). Guide to Operational Weather Radar Best Practices (WMO-No. 1257), Volume IV: Weather Radar Siting, Configuration and Scan Strategies. Geneva: WMO. ISBN 978-92-63-11257-6. https://library.wmo.int/viewer/68981/
World Meteorological Organization (WMO). (2005). Turkey Radar Training 1.0 / Alanya 2005: Radar Site Selection Criteria and Infrastructure Requirements. Geneva: WMO. https://old.wmo.int/extranet/pages/prog/www/IMOP/ISO/Std_Radar_Part1_For_Members_Review.pdf
Oyarzún Jiménez, C. F. (2021). Propuesta de sitio para la instalación de un radar meteorológico en la Región del Biobío: potenciales ventajas para la detección temprana de amenazas hidrometeorológicas [Site proposal for the installation of a weather radar in the Biobío Region: potential advantages for early detection of hydrometeorological threats] (Undergraduate thesis). Universidad de Chile, Santiago. https://repositorio.uchile.cl/handle/2250/183882
Sichuan Hydrology Center. (2025, December 18). 跋涉川东寻»天眼»——达州测雨雷达选址工作侧记 [Trekking through eastern Sichuan in search of the «celestial eye»: notes on the siting work of the Dazhou rain-measuring radar]. Sichuan Department of Water Resources. http://slt.sc.gov.cn/scsslt/dfss/2025/12/18/c9aa7161b7794ad5be7b320dfa0874a6.shtml
Öztürk, K., & Çubuk, A. (2018). The Interactive Weather Radar Visibility Analysis Tool. Turkish State Meteorological Service (TSMS), Remote Sensing Division. Presented at TECO-2018, WMO. https://old.wmo.int/extranet/pages/prog/www/IMOP/TECO-2018/pdf/poster%20abstracts/topic%203/P3_1_Ozturk_et%20al_ExtendedAbstract.pdf
Bureau of Meteorology (BOM). (2024, November 7). What does it take to build a weather radar? BOM Blog. https://media.bom.gov.au/social/blog/2943/what-does-it-take-to-build-a-weather-radar/
Wiklimat. (n.d.). Radar hydrométéorologique : Principes de fonctionnement [Hydrometeorological radar: Operating principles]. Ministère de la Transition écologique et de la Cohésion des territoires, France. http://wiklimat.developpement-durable.gouv.fr
Radio Habana Cuba. (n.d.). Red cubana de radares preparada para asumir temporada ciclónica [Cuban radar network prepared to take on hurricane season]. https://www.radiohc.cu/generate/pdf/article/166211
Granma. (2022, November 15). La inusual independencia tecnológica de Cuba de los fabricantes de radares [Cuba’s unusual technological independence from radar manufacturers]. Granma. https://www.granma.cu
Meteoradares. (2026, February 18). LADETEC y los radares meteorológicos: rompiendo las cadenas de la dependencia tecnológica [LADETEC and weather radars: breaking the chains of technological dependence]. https://meteoradares.wordpress.com
Federal Aviation Administration (FAA). (2024). Siting Criteria for Terminal Doppler Weather Radar (TDWR) (Order JO 6315.4). U.S. Department of Transportation. https://www.faa.gov/documentLibrary/media/Order/JO_6315_4.pdf
Deja una respuesta