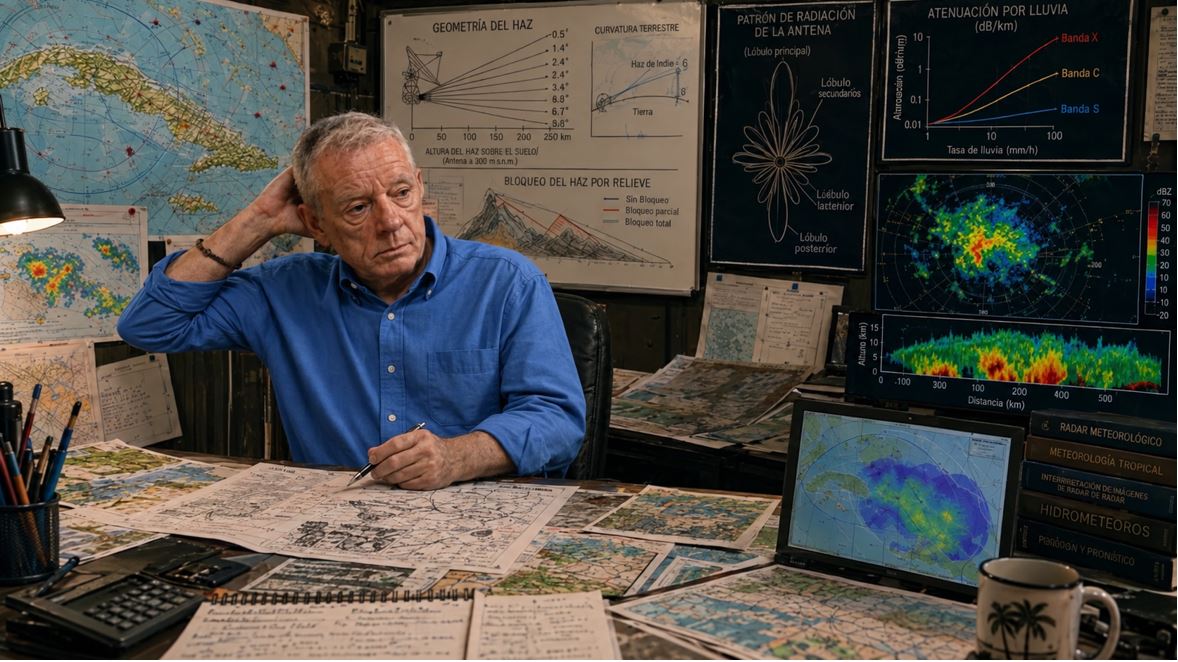
Decision-makers, investors, donors, managers, and administrators usually take one parameter that every manufacturer provides for a radar — “range” — and draw a point on a map where each radar is located, with a circle around it. And they feel happy. Mission accomplished: we are protecting all this area (referring to the area of the circle they drew). Our radar(s) guarantee excellent coverage for the country (or region, depending on what it is about).
As always, I get the role of party pooper: things are not that simple. I tell you this not because it bothers me that anyone boasts about whatever they want, but so that life does not disappoint you later, when the radar fails to see intense precipitation that ends in flash flooding, or fails to see a devastating storm until it begins to cause havoc.
So that my restless reader better understands how manufacturers manipulate — and those who manage the purchase gladly accept — the term “radar coverage,” I will give you an example. Suppose you are a seller of spearguns for underwater hunting. Let’s take as a reference one of the best-selling and most versatile models on the market, such as the Cressi Comanche Rail or the Salvimar V: the spear launched into the air at 45 degrees can reach 100 meters. However, spearguns are used underwater, and in that medium, the spear barely travels 3–4 meters (depending on many factors). What distance would you use to advertise the effectiveness of your speargun? Exactly: the best figure, under the most favorable conditions.
The same thing happens with radar: the manufacturer gives you the theoretical maximum range, measured under the most favorable conditions and for the most detectable phenomenon. Real coverage is another story.
But let’s go step by step, as Jack would say, and dissect all the factors on which radar coverage depends.
Technological Aspects
Several technological parameters define the radar’s coverage: the frequency (wavelength) at which it radiates, the polarization of the radiation, the transmitted power, the receiver sensitivity, and the width of the beam radiated by the antenna into the atmosphere.
Frequency / Wavelength
Weather surveillance radars operate mainly in three bands of the electromagnetic spectrum: S band (2.7–2.9 GHz), C band (5.4–5.65 GHz), and X band (9.3–9.5 GHz). Worldwide, of the radars reported to the WMO, 40% are S-band, 53% are C-band, and only 7% are X-band.
I have discussed the band in which a radar operates in great detail in the post Which band should be used for radars? Here I only want to tear apart a cliché that, through repeated use, has become a myth: that to have very long range (460–600 km) you must use S band, for medium range (240–300 km) you must use C band, and for short ranges (60–150 km) you must use X band.
I worked for many years with MRL-5 radars, which use S and X bands simultaneously. I can assure you that, with the X-band channel — even before the modifications we made in Cuba — we saw echoes up to 300 km. Later we increased the range to 500 km, and we continued to see meteorological echoes with both channels. Moreover, the X-band channel detected the appearance of radio echoes earlier than the S-band channel, no matter how distant they were.
The problem comes with attenuation. The wavelengths of C band and especially X band are strongly attenuated when passing through areas of intense precipitation. An X-band radar (if it has adequate transmitter power, receiver sensitivity, and antenna beam width) can see echoes up to 500 km. However, if an intense and extensive precipitation area lies across the path, no matter how far away it is, behind it the X-band channel goes blind, while the S-band channel sees perfectly along the entire path. It is clear: the longer the path, the greater the probability that the X-band channel will be blinded.
For this reason, C-band radars are usually dedicated to medium distances and X-band radars to very short distances, reducing the probability that attenuation will blind them. When coverage of more than 400 km is desired, S-band radars are usually used (read more about S-band examples in: [1], [2], [3], [4]), because the attenuation suffered by radar frequencies in this band is practically negligible.
Polarization
Some hydrometeors are not spherical and have a preferentially horizontal orientation, meaning their longer side is oriented horizontally. For example, very small water droplets are spherical, but as they grow they become flattened, with the longer side horizontal. Other hydrometeors tend to be larger vertically. The polarization of the wave emitted by the radar is important for detecting them better (detecting them farther away, which is what interests us for coverage).
If both polarizations are available, so much the better for some things; but keep in mind that, in most modern radars, all the power radiated by the transmitter — and which the manufacturer specifies in its catalogs — is split in half for each polarization. Therefore, the coverage of each one is lower than if all the power were radiated in a single polarization (preferably horizontal).
If an S-band radar has a specified peak power of 850 kW (that is, in the pulse), it will radiate only 425 kW in each polarization: half, −3 dB. Therefore, for coverage purposes, it is worse than an S-band radar that radiated all its power (the same 850 kW) in a single polarization. The matter is more complicated: the polarimetric radar ends up being about 5 dB less sensitive than a single-polarization radar, which translates into a notable reduction in range for the same hydrometeor size. Read the details in the post: Dual Polarization. Advantages and… disadvantages?
The Minimum Detectable Signal
When we talk about radar coverage, what we mean is how far the radar can see. And to define “that” — that is, what does “see” mean? — we must know what is “the minimum” the radar can distinguish; and by “minimum,” of course, we are talking about the reflectivity of a meteorological object.
Before continuing, I advise my reader to take a look at my post What do weather radars measure? and also this other one: The weather radar equation, so you understand what follows.
In this section we will refer only to those technological parameters that intervene in the equation. We are talking about transmitter power, receiver sensitivity, and antenna parameters. Everything is very simple: the more powerful the transmitter, the more sensitive the receiver, and the larger the antenna (higher gain and a narrower beam), the greater the coverage the radar will have; that is, the farther it can distinguish small or weak meteorological objects, or both.
The matter is complicated. To define the coverage the radar provides, we must first set a minimum detectable signal. And yes, this is a parameter that DEPENDS ON THE DISTANCE between the object and the radar. There are objects we see at a few kilometers that, when they move away, we can no longer see. That is, coverage depends on the type of meteorological object (hydrometeor) we take as a reference. Thus, the farther away the object is, the harder it is to perceive it.
The minimum detectable reflectivity (Zmin) increases with distance. The farther away the object is, the larger it must be for the radar to capture it.
This topic deserves a separate post, but I will advance the central idea: coverage is not a number, it is a function that depends on the size and type of hydrometeor we want to detect. For now, look at the graph of four radars: the RD-200S (the S-band channel of the Camagüey radar), the RD-200X (the X-band channel of the Camagüey radar), the WSR-88D (original), and its polarimetric version WSR-88DP.
To define coverage, we must first define the minimum detectable signal, and this will be related to the type of phenomenon we want to see. We will deal with this topic in the last section of this post.
Wave Propagation
It is important to note that, depending on the vertical profile of the refractive index, radar waves will propagate in three different modes: normal refraction, subrefraction, and superrefraction, with a limiting case when ducts form. The reader can find the detailed physical explanation in numerous Physics and Radar texts.
The only thing I emphasize here is that coverage — that is, the maximum range — depends on atmospheric conditions (which depend on vertical profiles of humidity and temperature).
No: coverage is not a fixed value determined by a manufacturer. It varies from one day to another, it varies according to the time of day, it varies with the season of the year.
This is a topic I have not yet touched on in my blog, but the reader can find numerous publications explaining it.
The Scanning Mode
Above we talked about characteristics inherent to the radar that are permanent. Now we will talk about the characteristics and parameters that we can modify in operation; that is, how we operate the radar to extract as much meteorological information as possible. By modifying parameters, we will be modifying coverage, which will be different depending on the parameters we vary.
Operating Regime
The operating regime is related to pulse duration and pulse repetition frequency (period). Although there can be several pulse durations and several repetition frequencies, there are two regimes that emerge from the Doppler Dilemma:
- Long pulse (2.0–4.5 microseconds) and low repetition frequencies (200–350 Hz), used to obtain the greatest possible range (400–600 km) by maximizing the reflectivity variable.
- Short pulse (0.5–1.0 microseconds) and high repetition frequencies (600–1500 Hz), used to guarantee reading high radial velocity values, consequently at shorter distances (50–150 km).
What is clear is that there are two types of coverage: one for long range, to measure reflectivity, which reaches 400–600 km and is the one the manufacturer advertises; and another for measuring velocity, which generally does not exceed 150 km for S-band radars (in C and X bands it is even shorter).
The Scanning Strategy
Ideally, one would gradually raise the antenna from zero degrees in the vertical up to 60–80 degrees, executing one revolution at each angle, and the elevation increment would be smaller than the radar beam width to be sure of covering everything.
However, this is not possible. Each revolution takes 10–12 seconds. And meanwhile, the atmosphere does not remain static waiting for us to scan it. The processes are dynamic and some are so fast that the entire scan must be accelerated to less than 5 minutes, or we run the risk of seeing one phenomenon in the lower part and a different one when we reach the upper part.
It becomes necessary, therefore, to choose a strategy that allows us to better capture each type of phenomenon. For each revolution, we must select the speed at which the antenna moves (which will define the number of transmitter pulses according to the selected regime) and the elevation angle in the vertical. The set of angles determines the upper angle up to which scanning will be done.
Since scanning is generally not done above 20–25 degrees elevation, a gap remains over the radar. To better understand this problem, I suggest reading the post: The cone of silence over radars, where rain is not seen.
Operating Mode
In NEXRAD and, in general, in any radar system, two operating modes are defined: when there is no precipitation in the atmosphere (they call it “Clear Air Mode”) and when precipitation of a certain range appears, which is then called “Precipitation Mode.”
Each of them has a combination of scanning strategies and operating regimes that are pre-designed so that the operator selects the most appropriate one for the prevailing meteorological situation.
In the NEXRAD system they call it VCP (Volume Coverage Pattern). Read the post: VCP in NEXRAD: The mystery of scanning the atmosphere.
Topography
Blocking Angles
Suppose you have bought a Doppler and polarimetric S-band radar, and the manufacturer assures you that it guarantees coverage of 400–600 km radius (depending on the model).
You locate it in a valley surrounded by mountains, and the radar coverage will not be the nominal 400–600 km, but the distance to the mountains or obstacles (which may be buildings) surrounding the radar.
Here I show you an example of how blocking angles can be seen in radar images themselves. This is the METEOR-1500S radar, located on El Paraíso hill near the city of Holguín, which has a blocked angle because the Loma del Fraile is very close, obstructing the main beam toward the E-SE. See the image processed with VESTA|Process.
Example of a blocking angle of the Holguín METEOR-1500S radar in the E-SE direction due to a higher hill nearby.
For the radar to have the 400–500 km range that the manufacturer promises, it must be located at a very high point dominating the surroundings. And even then, in many directions it will have blocking angles that will drastically reduce that nominal coverage. If in some direction there are obstacles higher than the radar, it will have “blocking angles” in that direction.
As the saying goes, “a picture is worth a thousand words”: I show you the case of the Jamaica radar, which is an excellent example to explain the topic.
The radar (a Defender SK 850 with a theoretical range of 600 km) is located at Cooper Hills. I show you in the image an analysis (approximate and rough, made with data available on the Internet) of the blocking angles that prevent it from having that coverage in certain directions when the radar points its antenna at 0.0 degrees.
Side Lobes and Relief
Apart from blocking angles, when a radar is elevated, with the main lobe unobstructed, it turns out that the lower secondary side lobes encounter irregularities in the relief and generate very powerful ground echoes that overshadow meteorological signals in that nearby area, hindering coverage.
There are numerous methods to suppress echoes returning from the ground. I recommend reading the publication where I dealt with the topic (Suppression of non-meteorological echoes). However, generally this suppression entails the elimination (total or partial) of meteorological echoes that are captured by the main lobe, but whose signal is mixed with the signal coming from the side lobes, which comes from very powerful ground echoes.
In the image above I show you the case of two elevated radars in Cuba, on their respective peaks (Pico San Juan in the center of the country, and Gran Piedra in the east), which pick up powerful ground echoes with their side lobes. VESTA|Process suppresses them, but it also suppresses part of the meteorological echoes in the nearby area.
The Effect of Earth’s Curvature
Under standard (normal) propagation conditions, the radar beam, although optically pointing at zero degrees elevation, rises above the ground due to the curvature of the Earth.
The Earth curves more than the radar beam; therefore, as it moves away from the radar, the beam passes increasingly higher above the ground. This implies that the radar intercepts identical phenomena at ever greater heights.
Rain measurement (which is the part from the base of the cloud to the Earth’s surface) can only be done within a very small radius (no more than 100 km). Hence, NEXRAD precipitation products have a short radius. For more detail, see the post LAMULA™ORPG: product catalog (Builds 19 to 24).
When drawing a map with the coverage circles of NEXRAD radars, the circles are painted in three colors, differentiating how far coverage reaches from 3 to 20 thousand feet, then from 6 to 20 thousand feet, and the outermost circle, from 10 to 20 thousand feet (see the detail in this information from the Radar Operations Center).
Currently in the United States, the company Climavision installs short-range X-band radars to provide low-altitude coverage in the gaps left by WSR-88D radars. Read more here. That is: low-altitude coverage is a scarce commodity, and that is why Climavision installs X-band radars in the WSR-88D gaps.
The Type of Meteorological Phenomenon: The Forgotten Factor
This is where the distinction between types of phenomena becomes critical for the coverage issue:
Stratiform phenomena (warm front rains, nimbostratus clouds): they have a relatively uniform vertical structure, with a bright band where ice melts and reflectivity increases. The precipitation that reaches the ground is related to what we see aloft, but the relationship is not trivial. For these cases, modern radars apply a vertical profile correction (VPR — Vertical Profile of Reflectivity) that adjusts the reflectivity observed aloft to estimate what would be at the surface. But this correction only works reasonably well in stratiform situations, where the vertical profile is stable and predictable.
Convective phenomena (storms, showers, intense rain cells): they have a very variable and chaotic vertical structure. Reflectivity can vary enormously between the base and the top of the cloud. The vertical profile correction is much less reliable in convection, because the profile changes rapidly in space and time. However, convective storms reach great heights (frequently >10–15 km), so they are detectable at much greater distances than stratiform phenomena. A radar can see a convective storm at 400 km, but what it sees is its top, not the rain at the surface.
Conclusions
- Radar coverage is not a single parameter, but a set of parameters that depend on the context.
- The manufacturer’s circle is a useful simplification for marketing, but dangerous for decision-making.
- To evaluate the real coverage of a radar network, one must consider the terrain, the atmosphere, the operating modes, and the phenomena to be detected.
- If someone promises you total coverage with a single radar, be suspicious.
As you have seen, radar coverage is not a circle on a map. It is a three-dimensional volume that changes with time, the atmosphere, the terrain, and the phenomenon we want to detect. Anyone who tells you otherwise is selling you a speargun based on its range in the air.
Deja una respuesta