A post about everything related to radar data resolution. Versión en español aquí
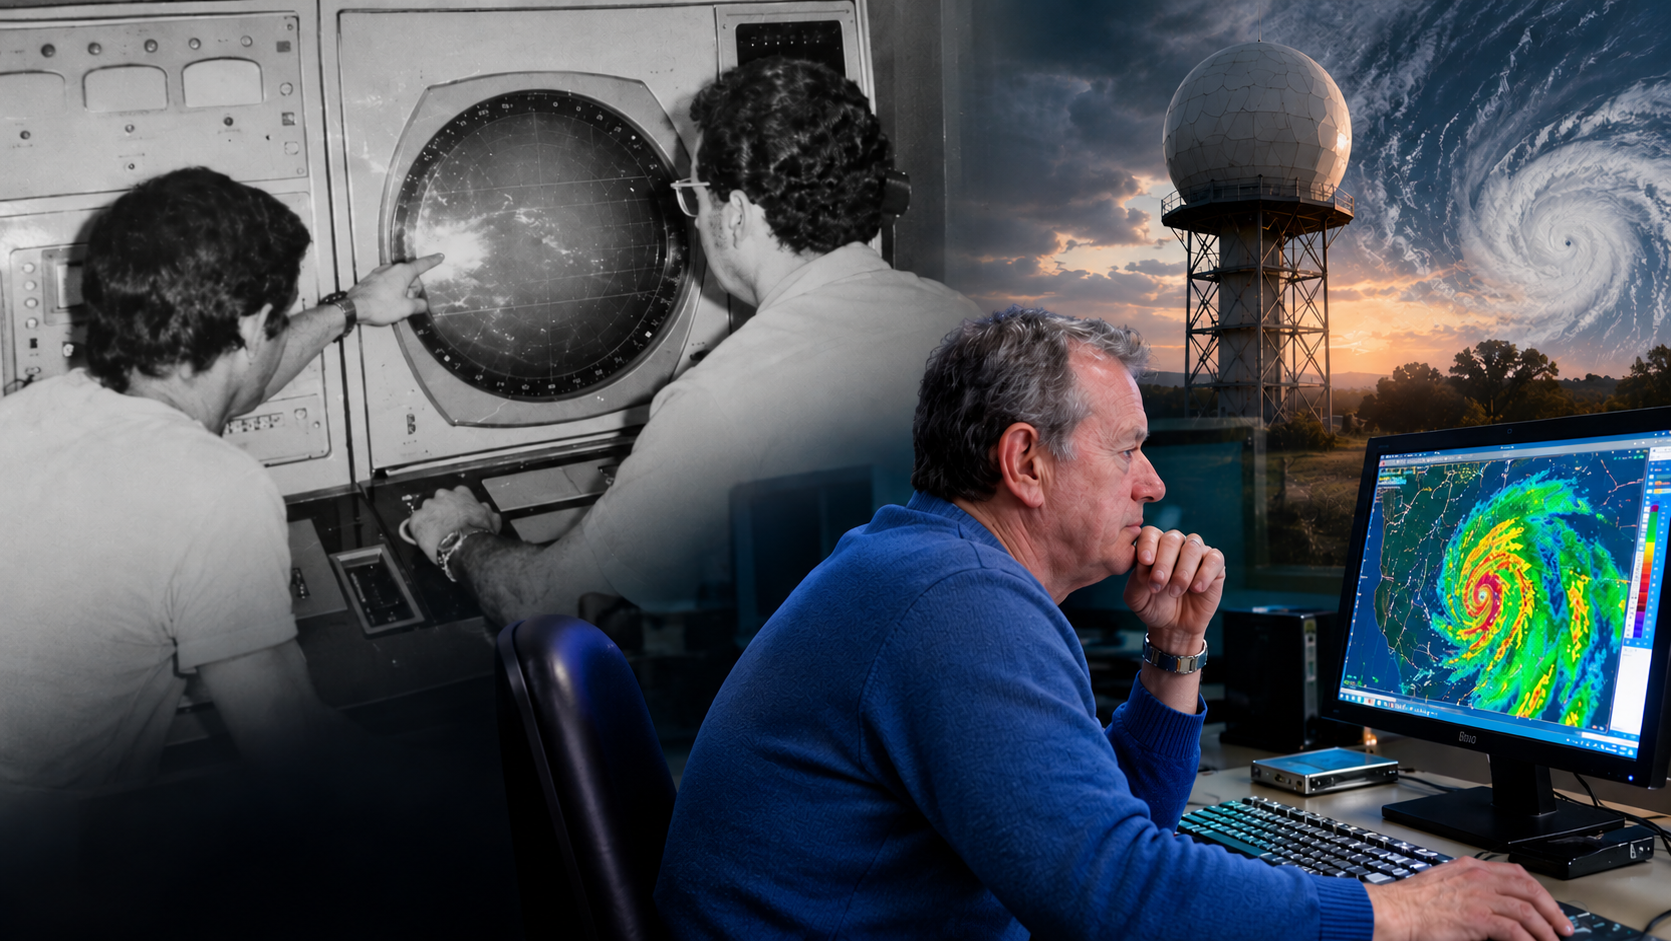
Meteorologists like to look at radar images to observe the morphology, evolution, and movement of echoes on the screen, without worrying much about how each pixel relates to what is happening in its surroundings, or about knowing exactly what each one represents in the atmosphere being explored. This is not a trivial matter, and I do not think it has a single answer. The fact that during my career the technique has gone from old monochrome PPI/RHI indicators to full-color computer screens does not change the essence of the question: What does each pixel represent in the atmosphere being explored? Follow me in this post to inoculate you with the virus of doubt and start looking at the images on the screen while thinking about the radar beam scanning the atmosphere.
A post about hydrometeor classification in polarimetric radars, regional bias, and the invisible geography of algorithms.Versión en español aquí.
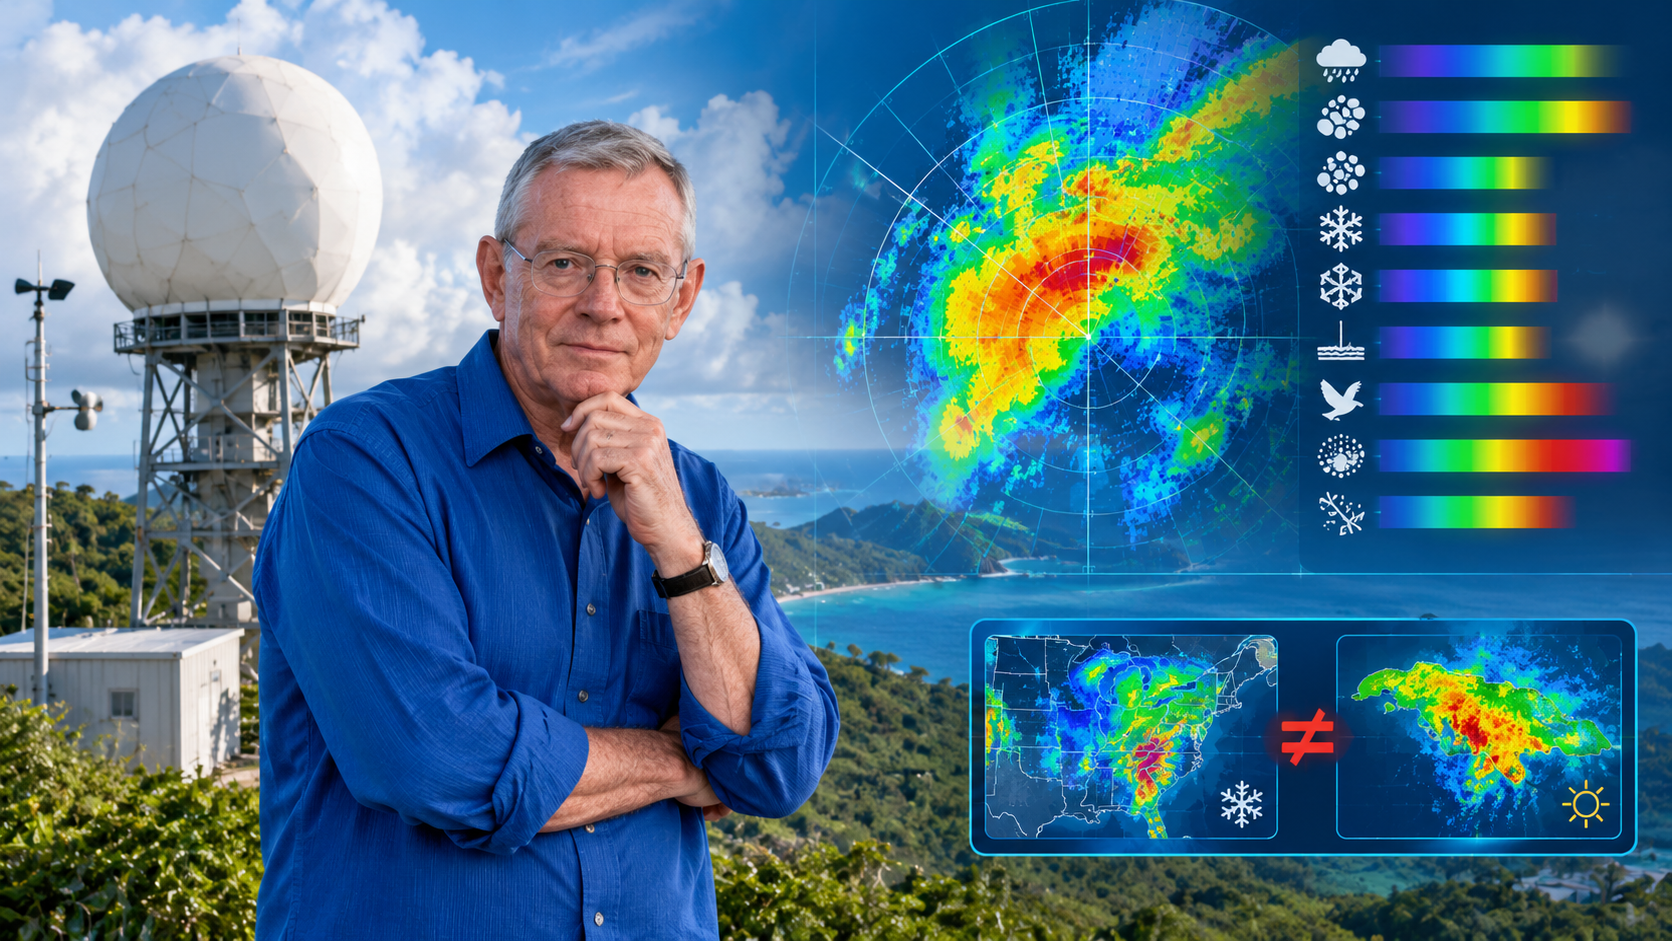
Hydrometeor classifiers (HCA/HID) operating in commercial polarimetric radars are, for the most part, fuzzy logic implementations built from observational campaigns, electromagnetic simulations, and microphysical knowledge generated in mid-latitudes. When these classifiers are deployed in tropical regions — such as the Caribbean or northern South America — their membership functions and decision thresholds no longer represent local physics. This article examines the case of two manufacturers (EEC and Vaisala), two countries (Jamaica and Colombia), and argues that the bias is not a calibration defect but a structural consequence of importing regional models disguised as universal products. A local validation framework is proposed and its application to microburst detection is explored.
1. Introduction: A Complaint That Wasn’t Technical
A colleague of mine at Colombia’s Civil Aviation Authority worked with data from a Doppler and Polarimetric radar. A few years ago we met, and she told me a complaint that wasn’t technical but almost existential: her radar’s hydrometeor classifier was flagging snow in warm regions of the country. Regions where the 0 °C isotherm sits at 4,800 meters and where it has never snowed at ground level. Pilots reported rain. The classifier insisted on snow.
She knew the radar was well calibrated. ZDR adjusted, PhiDP without offset, RhoHV coherent. And yet the flagship product — the one that tells you what kind of particle is falling from the sky — was lying.
That complaint is the origin of this article. Because the problem wasn’t a bug. It was something deeper and more uncomfortable: the classifier didn’t know Colombia. And the same could be said of Jamaica. Or Puerto Rico. Or any place where a polarimetric radar looks at a sky for which its algorithm was not designed.
2. Calibrating Is Not Classifying
It’s worth separating two things that are often confused.
Calibrating a polarimetric radar means ensuring that what it measures corresponds to what’s actually there. That Zh has no bias, that ZDR is centered, that PhiDP has no offset, that RhoHV reflects real coherence. It’s an instrumentation problem. Difficult, but bounded.
Classifying hydrometeors is something else. It means taking those already-calibrated variables and deciding, through a model, whether what you’re seeing is light rain, heavy rain, big drops, hail, graupel, dry snow, wet snow, ice crystals, biota, or clutter. It’s an inference problem.
The most common classifier in operational radars — in both EEC and Vaisala, as we’ll see — uses fuzzy logic. Membership functions are defined for each polarimetric variable, inference rules are built along the lines of «if Zh is high and ZDR is low and RhoHV is high, then probably hail,» and they’re combined to obtain a degree of membership for each class.
The problem is that those functions and those rules don’t come out of thin air. They’re built, adjusted, and validated with observational campaigns, electromagnetic simulations, and in-situ measurements made in a specific place. And there’s the catch: that «specific place» is almost never the tropics.
3. Two Cousins: EEC and Vaisala
This is where the story gets interesting. Because one might think the problem belongs to a single manufacturer. It doesn’t. It belongs to a shared philosophy.
3.1 EEC and the NOAA/NSSL Lineage
Jamaica operates an EEC Defender, S-band, 8.5-meter antenna. EEC — Enterprise Electronics Corporation — is headquartered in Enterprise, Alabama. It’s not poetic coincidence: it’s literal. The radar watching the Caribbean from Jamaica was manufactured in a city in the southern United States.
Everything indicates that EEC incorporated into its radars the classification line developed by the group of Alexander V. Ryzhkov and Dusan S. Zrnić at NOAA/NSSL, based on fuzzy logic. EEC’s own technical material points to their integration of the hydrometeor classification algorithms developed for the WSR-88D platform — the U.S. NEXRAD network — (Ryzhkov & Zrnić, 2019).
That classifier primarily uses:
Zh (horizontal reflectivity)
ZDR (differential reflectivity)
RhoHV (correlation coefficient)
KDP (specific differential phase)
Temperature information
Melting layer detection
And it classifies roughly ten categories: rain, heavy rain, big drops, small hail, large hail, graupel, dry snow, wet snow, ice crystals, and biological/non-meteorological echoes.
The membership functions of that classifier were built from polarimetric observation campaigns in Oklahoma, Alabama, and other mid-latitude continental regions; T-Matrix electromagnetic simulations; in-situ measurements; and expert microphysical knowledge. That is: rigorous physics, but physics of mid-latitude continents.
3.2 Vaisala and HydroClass
Colombia operates Vaisala radars, mainly WRM200 in C-band. Vaisala incorporates a module called HydroClass™, and explicitly states that it uses «a proven fuzzy logic algorithm» to classify meteorological and non-meteorological targets (Vaisala, 2021).
Notice something. Neither of them trains with massive historical datasets. Neither uses modern machine learning. Both follow the same recipe:
Physical simulation of hydrometeors (T-Matrix)
Construction of characteristic regions in polarimetric space
Classification via fuzzy logic
Correction using ambient temperature
They’re cousins. They share physics, share method, share limitations. And they share the same problem when they land in the tropics: neither was built with the 0 °C isotherm at 5 km in mind.
That means the bias doesn’t come from «bad training data.» It comes from something deeper: the campaigns, the measurements, and the expert knowledge are from one place. The T-Matrix simulates particles, but the particles it simulates are the ones someone decided to simulate. The campaigns were done in Oklahoma, in Darwin, in Helsinki. The expert knowledge is expert in something.
The classifier isn’t «poorly trained.» It’s trained for another place. And that’s harder to fix than retraining with data.
4. Tropical Physics Is Not Mid-Latitude Physics
There’s an important nuance here that my reader should keep in mind: the symptom changes depending on the radar’s operating band, but the disease is the same.
4.1 The Case of Jamaica (S-band)
S-band has a huge advantage: rain attenuation is much lower than in C- or X-band. That means the problem isn’t attenuation. The problem is something else.
The 0 °C isotherm sits at 5 km. In mid-latitudes it sits at 2–3 km. A Jamaican radar can be sampling ice at 4 km altitude — ice that melts before reaching the ground. The classifier sees ice and says «snow.» The pilot reports rain. Both are right; the HID doesn’t distinguish between «there’s ice in the sampling volume» and «snow is falling at the surface.»
Warm microphysics dominates. Zipser et al. (2006) documented why maritime tropical convection — such as the Caribbean’s — exhibits warm microphysics signatures: efficient coalescence, high liquid water content, small-to-medium drops that rarely reach the freezing point at low levels. Unlike mid-latitude continental storms, where updrafts generate large ice structures, here rain is produced without the need for an extensive ice phase.
This translates into moderate reflectivities with high KDP. And the traditional boundaries of the classifier fail: they associate those reflectivity levels with ice mixtures, when in reality it’s efficient warm rain.
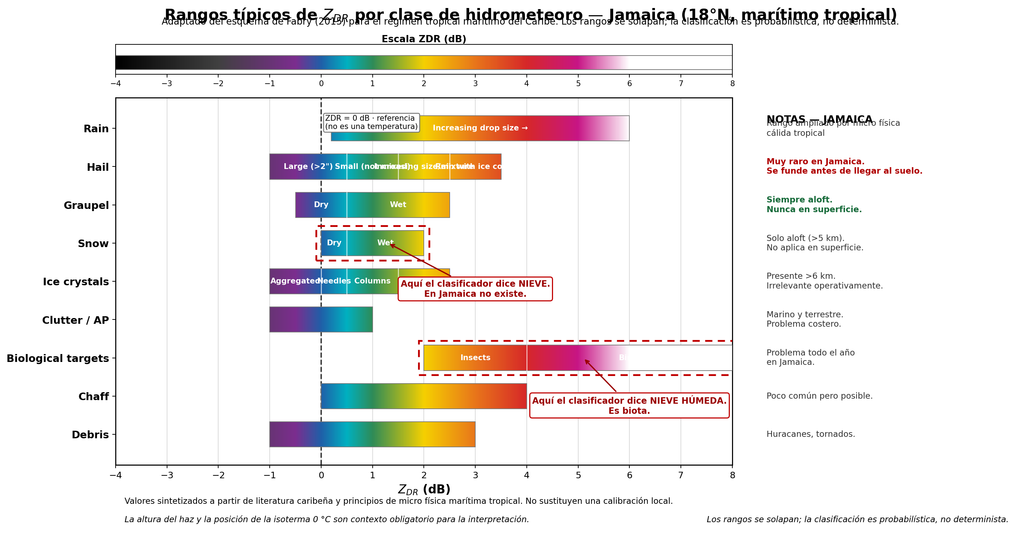
Figure 1. Typical ZDR ranges by hydrometeor class for Jamaica (18°N, maritime tropical). Adapted from Fabry’s (2015) scheme. Each horizontal bar represents the ZDR range associated with a category, colored according to a continuous chromatic scale. The ranges deliberately overlap to reflect the inherent ambiguity of polarimetric classification; class assignment is probabilistic, not deterministic. Note the absence of an operational «dry snow» region at the surface — the Snow bar corresponds exclusively to ice aloft that melts before reaching the ground — and the unusually wide Rain range, a consequence of tropical warm microphysics. The two dotted boxes highlight the most frequent confusions of the imported classifier: the Snow category, which in Jamaica corresponds to graupel aloft and not surface snow, and the Biological targets category, which the HCA erroneously labels as «wet snow» when in reality it’s biota. The dashed vertical line at ZDR = 0 marks the boundary between spherical and oblate particles, not a temperature; the 0 °C isotherm, which in Jamaica sits around 5 km altitude, must be consulted separately via soundings or vertical profiles.
The ambiguity between big drops and melting hail. In S-band the Mie effect is smaller than in C-band, but it doesn’t disappear. Large drops and melting hail can occupy neighboring regions of polarimetric space. The NSSL/Ryzhkov classifier, tuned with continental microphysics, tends to lean toward ice.
Biota is a year-round problem. Warm marine boundary layer, insects, birds. High ZDR with low RhoHV. The classifier says «wet snow.» It’s not snow: it’s life.
4.2 The Case of Colombia (C-band)
Here another problem is added: severe differential attenuation.
In C-band, intense tropical storms absorb and scatter energy asymmetrically between the H and V channels. If a rigorous correction based on KDP is not applied, Zh and ZDR drop artificially behind the convective core. And there the classifier goes haywire: it labels heavy rain as dry snow, melting hail, or total attenuation (Bringi & Chandrasekar, 2001; Vaisala, 2021).
4.3 The Lesson
Same classifier, same assumptions, same bias. But:
In Jamaica (S-band), the problem is the high isotherm and warm microphysics.
In Colombia (C-band), differential attenuation is added.
Same disease, different symptoms.
5. The Colombian Case: Two Manufacturers, One Challenge
Colombia offers a particularly rich case study, because at least two manufacturers with different classification philosophies coexist in its territory, both operating in C-band and both in a tropical regime.
5.1 SIATA (Medellín): EEC in C-band, Locally Adapted
The Early Warning System of Medellín and the Aburrá Valley operates a polarimetric EEC radar in C-band — the same manufacturer that supplies Jamaica’s radar — in complex topography and tropical Andean convection. This means it faces two simultaneous problems: tropical warm microphysics (high isotherm, large drops, graupel aloft) and the severe differential attenuation characteristic of C-band.
The SIATA team has developed local classification models by adapting traditional fuzzy logic, with KDP-based attenuation correction before feeding the membership vector (SIATA, 2020; Hoyos et al., 2016). Validation combines the dense Parsivel disdrometer network with lightning detection sensors and profiling radars.
The SIATA case is valuable for two reasons. First, because it demonstrates that it can be done well in tropical C-band, with the right instruments. Second, because it’s the same manufacturer as Jamaica, allowing a direct comparison: both are EEC, both use NSSL-HCA derivatives, but SIATA has been locally adapted while there is no public evidence that Jamaica has done the same.
5.2 Aerocivil (Colombia): Vaisala in C-band
Colombia’s Civil Aviation Authority operates Vaisala WRM200 radars in C-band. This is the case that originated this article: Vaisala’s HydroClass classifier reporting snow in warm regions where pilots report rain. A Finnish classifier, applied to a Colombian sky.
5.3 The Question That Arises on Its Own
If SIATA (EEC, C-band) has been locally adapted and Aerocivil (Vaisala, C-band) reports the classic symptom of regional bias, then the question isn’t «which manufacturer is better?» The question is: how many radars in the tropics are operating with classifiers that were never locally validated?
6. It’s Not an Anecdote. It’s a Documented Pattern
What my colleague saw in Colombia isn’t a rarity. It’s documented throughout the region and beyond.
Puerto Rico (NEXRAD TJUA, S-band). Research from the University of Puerto Rico at Mayagüez and collaborators has analyzed the response of the official NOAA HCA during hurricanes and tropical cyclones. Key finding: in pure tropical systems dominated by warm microphysics, the classifier erroneously labels torrential rain zones with moderate Zh and high KDP as «rain and hail mixture.» Adjustments have been proposed to raise ZDR and KDP thresholds in detecting very heavy rain.
Guadeloupe and Martinique (Météo-France, C-band). Cross-validation campaigns with TRMM and GPM have allowed calibration of the melting layer height — 4.5 to 5.0 km in the Caribbean — and adjustment of membership functions to avoid false «wet snow» classification at mid-levels.
Colombia (SIATA, C-band). The case already described. Local classification models adapting fuzzy logic, with multi-instrument validation (SIATA, 2020; Hoyos et al., 2016).
Colombia (Universidad Distrital, C-band). The book by Camargo-Camargo, Cadena-Contreras & Alejo-Zabala (2022) documents how factory-default models in commercial radars, designed for mid-latitudes, overestimate the presence of ice and make errors in the melting zone. Señalin’s (2021) thesis develops a classification model specifically adapted to the warm microphysical dynamics of low latitudes.
India (CAIPEEX / IITM). The CAIPEEX campaign of the Indian Institute of Tropical Meteorology used dual-polarization radars in X- and C-band combined with Parsivel and 2DVD optical disdrometer networks, plus airborne instrumentation. They evaluated fuzzy logic membership functions adjusted to monsoon drop size distribution versus the standard S-band matrices set for mid-latitudes.
Australia (Darwin, C-POL). Thompson et al. developed a 10-category HCA in C-band optimized for tropical environments. Their explicit motivation was the electromagnetic ambiguity between big drops/melting hail and wet snow caused by Mie effects in C-band — exactly the kind of confusion a mid-latitude classifier doesn’t resolve.
The pattern is clear: everywhere an imported classifier has been validated in the tropics, the same bias has been found. It’s not a problem of a poorly calibrated radar. It’s a structural problem.
7. How to Do It Right: The Recipe
If the problem is structural, so is the solution. It’s not about throwing away the classifier. It’s about domesticating it.
7.1 Multi-Instrument In-Situ Validation
The most robust scheme, pioneered by SIATA in Colombia, combines three components:
Optical disdrometer network (Parsivel, 2DVD): directly measures drop size distribution (DSD) and fall velocity at the surface. Validates the radar’s microphysical assumptions.
Altitude soundings: determine the atmosphere’s thermal structure and the height of the 0 °C isotherm. Crucial data for constraining classification models.
7.2 Attenuation Correction with KDP
In C- and X-band, differential attenuation correction based on KDP is mandatory before feeding the classifier’s membership vector. Without it, false classifications downstream of the convective core are inevitable. This applies both to Colombia’s Vaisala WRM200 radars and to SIATA in Medellín, both in C-band.
7.3 Re-Adjusting Membership Functions with Local DSD
Work by UNAM in Yucatán, Universidad Distrital in Colombia, and CAIPEEX in India all agree: the HCA’s beta membership functions must be built with electromagnetic scattering data (T-Matrix) fed with local DSDs. Not with the standard NEXRAD or European matrices.
7.4 Introducing Temperature and Height as Context Variables
The classifier should know at what altitude it’s measuring. A pixel at 5 km in Jamaica is not the same as a pixel at 5 km in Finland. If the HID doesn’t incorporate the height of the 0 °C isotherm, it’s doomed to be wrong.
7.5 Cross-Validation with Spaceborne Remote Sensors
Cross-referencing the 3D classification from the ground radar with the GPM DPR or TRMM PR classification allows confirmation of the vertical structure of the melting layer and graupel cores over sea and land in the tropics (Dolan & Rutledge, 2009, 2011).
7.6 Transparency and Quality Flags
A good operational HID should indicate uncertainty per class, include an «unknown class» or «low confidence» label, avoid forcing a classification when variables aren’t conclusive, and document which region it was trained for and what its limitations are.
8. Beyond the HID: The Microburst Opportunity
And this is where the article stops being a critique and becomes a proposal.
Because the hydrometeor classifier is not the final product. It’s an input. And for certain applications — microburst detection, severe convection nowcasting, early warning — the traditional HID falls short, not because it’s wrong, but because it wasn’t designed for that.
For microburst detection, the real value lies in combining:
Predominant hydrometeor (HID output)
ZDR column (updraft signature with big drops)
KDP column (liquid water content)
Doppler divergence (surface wind signature)
Maximum reflectivity descent (downburst signature)
Height of the graupel and hail region (charging mechanism)
Traditional HIDs aren’t designed for this. They’re designed to say «this is rain» or «this is hail.» But a modern microburst nowcasting system could use HID outputs as one more variable within a broader scheme.
There’s a concrete opportunity here. With an S-band polarimetric radar like Jamaica’s — 8.5 m antenna, narrow beam, good resolution — one can develop a microburst risk classifier that:
Uses the HID (or HydroClass, or NSSL-HCA) as an input, not as a final product.
Incorporates ZDR and KDP columns as updraft detectors.
Combines with low-level Doppler divergence.
Constrains with local thermodynamic profile (0 °C isotherm at 5 km, CAPE, etc.).
Validates with surface reports and the LLWAS network if one exists.
That would be more modern than traditional HCAs. And it would be a real contribution, not just a complaint.
9. Conclusions
Calibrating (instrumentally) ZDR and PhiDP is essential. But it’s not enough. The HID is a regional model disguised as a universal product. And in tropical, Andean, or simply different regions, that disguise falls apart.
My colleague’s anecdote at Aerocivil isn’t a rarity. It’s a symptom. It’s what happens when we import technology without importing context. When we believe that an algorithm trained in Helsinki or Enterprise, Alabama, can tell us what’s falling from the sky over the Magdalena Medio. Let my reader not believe that a radar manufacturer can develop costly field experiments in the country where it’s going to install the radar. They take results published by universities and research centers that do these studies … valid only for the places where those studies are done.
The solution isn’t to throw away the classifier. It’s to domesticate it: validate it with disdrometers, re-adjust its membership functions with local DSDs, introduce temperature and beam height as context, correct attenuation with KDP, and above all, know when not to believe it.
And then take the next step: use the HID for what it is — an input — and build on top of it systems that answer more useful questions: Is there going to be a microburst? Is it going to hail? Is it going to rain hard enough to flood the valley?
Because in the end, the HID isn’t a truth. It’s a trained opinion. And like any opinion, you need to know where it comes from.
References
Bringi, V. N., & Chandrasekar, V. (2001). Polarimetric Doppler Weather Radar: Principles and Applications. Cambridge University Press.
Camargo-Camargo, J. E., Cadena-Contreras, L. A., & Alejo-Zabala, G. (2022). Estudio de hidrometeoros basado en información de variables polarimétricas de radares meteorológicos para Colombia. Editorial Universidad Distrital Francisco José de Caldas.
Dolan, B., & Rutledge, S. A. (2009). A theory-based hydrometeor identification algorithm for X-band polarimetric radars. Journal of Atmospheric and Oceanic Technology, 26(10), 2071–2088.
Dolan, B., & Rutledge, S. A. (2011). A theory-based hydrometeor identification algorithm for X-band polarimetric radars. Journal of Atmospheric and Oceanic Technology, 28(5), 621–637.
Doviak, R. J., & Zrnić, D. S. (1993). Doppler Radar and Weather Observations (2nd ed.). Academic Press.
Hoyos, C. D., Ceballos, L. I., Pérez, J. S., & Sepúlveda, J. I. (2016). The hydrometeorological monitoring network of the Aburrá Valley (SIATA): An integrated approach for early warning systems. Proceedings of the American Meteorological Society.
Michaelides, S. (Ed.). (2019). Precipitation Science: Measurement, Remote Sensing, Research and Applications. Elsevier.
Ryzhkov, A. V., & Zrnić, D. S. (2019). Radar Polarimetry for Weather Observations. Springer.
Señalin, M. A. (2021). Modelo de clasificación de hidrometeoros para zonas ecuatoriales. Repositorio de la Biblioteca Digital de Bogotá.
SIATA. (2020). Radares meteorológicos: Equipamiento, procesamiento de señales y variables polarimétricas. Documentación técnica del proyecto, Área Metropolitana del Valle de Aburrá.
Thompson, E. J., Rutledge, S. A., Dolan, B., Chandrasekar, V., & Cheong, B. L. (2014). A dual-polarization radar hydrometeor identification algorithm for X-band. Journal of Atmospheric and Oceanic Technology, 31(12), 2611–2627.
Thompson, E. J., et al. A Robust C-Band Hydrometeor Identification Algorithm and Its Application to Long-Term C-POL Observations in Darwin, Australia. Journal of Applied Meteorology and Climatology.
Vaisala. (2021). Corrección de atenuación de radares meteorológicos banda-C. Nota de aplicación técnica, Vaisala Oyj.
Zipser, E. J., Cecil, D. J., Liu, C., Nesbitt, S. W., & Yorty, D. P. (2006). Where are the most intense thunderstorms on Earth? Bulletin of the American Meteorological Society, 87(8), 1057–1072.
Author’s Note
This article is a divulgative review based on published literature, manufacturer technical documentation, and field observations in Colombia and the Caribbean. Statements about EEC’s classifier and its NSSL lineage are based on public technical documentation and reasonable inferences, not official communications from the manufacturer. Any reader with first-hand information is invited to contribute to the discussion.
Discover why calibrating weather radars (WMO-No. 1257) is essential to move from qualitative images to real quantitative data in storm monitoring and precipitation estimation. Sharing uncalibrated radar data is like counting guavas and apples as if they were one and the same set. Versión en español aquí.
If you are someone involved in the purchase or donation of a weather radar for a “developing” country—a very sugar-coated and euphemistic way of not saying underdeveloped—allow me to “stick my spoon in” (a Cuban saying for expressing an opinion nobody asked me for): the decisive question is not how many radars and of what types can be bought to help that country’s meteorology, but what that country will be able to keep running when the warranty expires, the supplier stops responding, the spare part does not arrive on time, the manufacturer becomes unreachable, and the budget has shrunk to a fraction of what was planned.
I do not speak about this from abstract theory, nor from a manual, nor from a conference room. I speak from forty-five years of work with radars on an archipelago that has been operating them for more than fifty years under a fierce blockade, without direct access to manufacturers, without the right to returns, and without even the possibility of asking technical questions about the spare parts that must be bought through tortuous channels—and with the obligation to get it right on the first try because there is no money for a second purchase. Here we have not learned to buy spare parts: we have learned to take each module apart in order to redesign it and build it from other components, and to keep a well-established list of options—from A to Z—to rebuild the functionality of any radar module that breaks down.
If someone is going to advise an underdeveloped country—let us set euphemisms aside, since we all know that the gap between developed and non-developed countries does nothing but widen—on acquiring technology that will have to work in that country’s real conditions, not ideal ones, I suggest looking at the Cuban experience: that of a kind of world champion in sustainability under very adverse conditions. I am not boasting; it is just that some questions can only be answered from the scars of a survivor of many battles.
A post about the organization, planning, execution, and control of weather radar surveillance. (En Español aquí)
I have known institutions and countries that got very excited about acquiring one or several radars, whether thanks to a timely donation or because they secured a budget to buy them.
Unfortunately, the prevailing idea is that the «turnkey» motto that vendors usually wave around means they have bought «the automatic forecaster»—a machine you plug in, let it run, and it will warn any would-be users of any dangerous weather phenomenon within its range. I hate to be a spoilsport, but things are far from that today.
Maybe AI will make it possible in the future, but I don’t see it happening anytime soon. Allow me to explain why.
Operational availability and measurement accuracy: the radar’s non‑negotiable standards
Like any other undertaking, using radars for a weather surveillance service has to be organized, planned, executed, and controlled if you want to get the results you can expect from such an expensive investment. Kind reader, please bear in mind that of all the tools available to meteorologists, radars are, by a long shot, the most costly investment—and therefore the one that demands the greatest effort to pay off.
You buy a car. It’s reasonable to expect that over the next five years, that car will be available whenever you need it. You use it every day, several times a day. Then one bad morning, when you’re heading to work… it won’t start. You exclaim angrily: «Today, of all days, when I needed it most, this damn thing won’t start!»—Liar! You need it every day, at any hour you happen to need it.
The same goes for radars. You need it every single day. If one day it breaks down, right when a storm is brewing, the meteorologists will be furious and the bosses will look for someone to blame. From this we can draw a conclusion: when you buy an expensive radar (they’re all expensive), you are entitled to uninterrupted operation 24/7/365. Every observation it is supposed to make is a fraction of the price you paid (amortizing the cost). If it doesn’t make that observation, that’s money you threw away and cannot recover—just as you cannot recover lost time.
So far we’ve talked in simple terms: works / doesn’t work. But it’s much more complicated than that. It’s not enough that the transmitter radiates, the receiver receives, and the antenna spins. The problem is that the radar is a measuring instrument that measures six variables: Reflectivity, Radial Velocity, and Spectral Width of radial velocities, repeated in two channels (horizontal and vertical). Like any measuring instrument, it must be calibrated in those three variables and between the two channels. So far, these are things that can be calibrated with precision and accuracy.
Planning
Planning is the foundation of successful surveillance. «A goal without a plan is just a wish» — Exupéry.
You wouldn’t buy a house without first having seen the neighborhood, without having asked about the quality of the neighbors, without having checked whether the roof can withstand the rains in your region, and without having calculated whether your budget can sustain the taxes and maintenance. Well, the same goes for a weather radar. The excitement of the purchase or the donation cannot be the only engine driving the decision. Planning is the foundation on which the entire service will rest for the next twenty or thirty years. If those foundations are made of mud, no matter how pretty the building is, it will come down with the first storm—and that’s precisely what you bought it for.
In this post we take for granted that the radars have already been acquired, but we cannot take for granted that they were planned properly. That is why, even if you already have them, it is worth reviewing what should have been done—because it will help you correct course in time and avoid repeating mistakes in future acquisitions.
Threat assessment: what do we want to see, and why?
Before even thinking about which radar to buy, you must sit down with the meteorologists, the civil protection officers, the airports, the farmers, and the water resource managers. Each of them has a list of phenomena they worry about. For some it’s flash floods; for others, destructive winds; for others, wind shear on runways; for others, hail that ruins crops.
Not all radars do everything. An S‑band radar (10 cm wavelength) is excellent for seeing deep storms and penetrating heavy rain without attenuation, but it is expensive and bulky. A C‑band radar (5 cm) is more compact and economical, but suffers more attenuation in very heavy rain. An X‑band radar (3 cm) is ideal for local and short‑range applications, but it is practically blind behind an intense storm. Planning means knowing which phenomena predominate in your region and choosing the radar that best detects them—not the one they offer you cheapest or the one they give you with the most pomp.
Radar siting: the art of seeing without being seen
The radar needs a clear line of sight to the horizon. Any obstacle—mountain, tall building, dense forest—produces blockages that hide entire areas. In mountainous regions, a single radar can never see into deep valleys; you need several, or a very high location, such as a mountain top. But beware: putting a radar on an isolated summit sounds great, but then comes access: how does the technician get there with the oscilloscope when there’s snow or mud? How is it powered reliably? How is it protected from lightning? Siting planning is an exercise in compromise between optimal coverage and logistical viability.
Also, you must consider interference with other radars. If you put two radars too close together and they operate on the same frequency, you’ll get an annoying «clutter» on the screens that will ruin the data. If you put them too far apart, you leave gaps. In countries with multiple radars, network planning is a puzzle that demands wave‑propagation studies and detailed topography.
Support infrastructure: the radar doesn’t live alone
A radar is not just a spinning antenna and an electronics cabin. It needs:
Stable electrical supply, with generator and battery backup that can last at least 48 hours of autonomy. In many countries, the power grid fails precisely when there is a storm—just when you need the radar most, the lights go out. Planning means installing generators of sufficient power, with stored fuel and scheduled maintenance.
Redundant communications: fiber optics are wonderful, but a single cut in the trench leaves the radar mute. You must plan for microwave links, satellite, or even backup radio links. It cannot be that the radar is seeing the storm perfectly, but the forecasters can’t see it because the link broke.
Physical access: passable roads year‑round, even in winter or rainy season. A radar that’s down because the technician couldn’t get to it is just as useless as if it were broken.
Lightning protection: radar towers are the highest points in the landscape; they attract lightning with fury. A well‑sized lightning‑rod system and a good grounding are mandatory investments, not luxuries.
Spare parts and critical consumables management: the logistics of survival
I’ve left this point for the end of planning because it’s often the most forgotten. And yet, it’s the one that saves the most headaches.
When you buy a car, you know that within five years you’ll need to change the tires, the brakes, the oil, and maybe the battery. For some brands, you can find spare parts on any corner; for others, you have to import them and wait weeks. With radars it’s the same, but with much longer lead times and much higher prices.
The magnetron or klystron—the tube that generates the transmission power—has a useful life of several tens of thousands of hours. But it doesn’t warn you when it’s going to fail. One day, it simply stops radiating. If you don’t have a spare one in the warehouse, your radar will be out of service for weeks or months, depending on import procedures, manufacturer availability, and available budget.
Planning means identifying, together with the manufacturer, the list of critical spare parts: those that, if they fail, leave the radar completely inoperative. Those must be in the warehouse from the day of installation. In addition, you must plan for periodic wear‑and‑tear spares: antenna motors, power supplies, electronic boards, high‑voltage cables. All of this requires an inventory, controlled rotation so they don’t deteriorate in storage, and a backup supplier (quite an art) in case the main manufacturer has delays.
You also need to plan for the consumables and third‑party services—auxiliary systems without which the radar doesn’t work: power, air conditioning, communications, and protections. You must identify the providers of these services and seek redundancy so that a failure in one of these systems doesn’t stop your radar. In certain countries this can be quite tricky, especially if the radars are in remote and hard‑to‑reach locations.
Also plan a multi‑year budget for these spare parts. It’s not a one‑time expense; it’s an annual fixed cost (estimated at 10‑15% of the radar’s price). Many institutions buy the radar with a million‑dollar budget and then have no funds for maintenance. It’s like buying an airplane and having no money for fuel or inspections. By the third year, the radar starts to fail; by the fifth, it becomes a metal ornament that only serves as a perch for birds.
Planning the human factor: it’s not all machinery
Planning must also consider the people who will operate and maintain the radar. Training a radar technician is not a two‑week course; it takes years of experience. If the institution doesn’t plan for recruitment and training before the radar arrives, it will end up with a shiny machine and nobody who knows how to use it.
You must plan factory training trips, refresher courses, exchanges with other countries, and above all, a succession plan: the expert engineer will retire someday—who will take their place? That question must be answered during the planning phase, not when the expert is already gone and the antenna has stopped spinning.
Planning, in summary, means answering these six questions before the radar arrives:
What phenomena are we going to monitor, and with what priority?
Where do we place the radar to see them best, without creating interference or access problems?
What technical specifications must the radar have for those phenomena and that location?
What infrastructure (power, communications, roads, protection) must we install?
Which spare parts and tools must we have from day one, and how will we renew them?
Which people are we going to train, and how do we ensure continuity?
If all these answers are clear and documented, then the purchase—or the donation—will be a sound investment. If not, it will be an expensive adventure whose results will depend more on luck than on talent. And meteorology, dear reader, cannot depend on luck.
Organization
Organizing is putting the work into motion: handing out the blueprints, assigning the trades, and setting the rules of the job, because no matter how good the bricks are, the building won’t rise on its own.
From this section onward we’ll assume the radars have already been acquired—by donation or purchase—and are ready to work. It is assumed that before acquiring them, a study was made of the dangerous phenomena derived from weather situations such as floods, landslides, mudslides, destructive winds (whether linear like downbursts or rotational like tornadoes), violent hail, or any other. And it is also assumed that the radars were suitably sited for detecting and tracking the situations that cause them. So let’s move on to the organizational activities.
Verification and calibration
If you’re the kind of person who goes to the hardware store and buys a shiny new digital multimeter from a good brand, and thinks that makes it ready to measure, you might start using your radar’s data «as the manufacturer gives it to you.» Then come the complaints that the Particle Classifier shows snow in very warm areas—a real complaint from a student in one of my courses.
Not only must you verify every parameter upon radar reception, but you must also establish routines and schedules for verification and calibration at regular intervals. That’s about periodicity, but much more complicated is establishing the methodologies for verification and calibration of all the radar modules and of the radar as a whole. Sometimes the manufacturer supplies some very general indications.
I have held in my hands the routines they use in the factory and in field radars, and they are extensive, detailed documents. Those routines require adaptation to the radars, to field conditions, and to the instruments and methods available in the service—that is, meticulous customization.
Modus vivendi
There are countries where radars belong to two or more different organizations. Each bought them for different purposes. For example, in Panama, two radars from different organizations are used harmoniously for the benefit of the country. In Colombia, four radars are operated by IDEAM and five by Civil Aviation (assuming the one in Pasto is still alive—I can’t find news about it, nor do I know whether the three new radars acquired from Baron are operational).
ICAO and WMO share a document they call a Modus Vivendi to regulate interactions related to meteorology. At the country level, agreements and documents are also needed so that the radars of both organizations serve not only their own purposes but also those of the other.
Let me give you an example: wind shear is disastrous for aviation, but it’s generally of little concern to the general population. Similarly, floods rarely affect airports, because they were built safe from them.
Coordination and cooperation are needed for the country’s benefit, but that cannot be left to goodwill; detailed instructions are required for joint operation in the face of each type of phenomenon.
Mode of operation
I usually divide it into three aspects: the work regime, the scanning strategy, and the mode of operation (see my post Operación de los radares meteorológicos for details). There are hundreds of ways these aspects can be combined to make an observation. In the NEXRAD ecosystem they called it VCP (Volume Coverage Pattern—see my post VCP en NEXRAD: El misterio de explorar la atmósfera), i.e., the way we scan the atmosphere. Many elements of a radar’s behavior can be modified to explore the atmosphere.
In operational practice, it’s very cumbersome to configure a VCP on the fly for every phenomenon; you need to have them configured in advance, and not so many that you have to study before choosing one. Some dangerous phenomena have a life cycle of only 10‑15 minutes. You have to make the right decision about which VCP can best capture it in just a few minutes.
Exchanging images (of some products) between radars of different organizations is good. Exchanging primary data is even better. But if you don’t unify the modes of operation and ensure the same modes for the same phenomena, the exchange is just a mirage.
IT aspects
By IT aspects I mean organizing the data flow from the radars to the end users. If the data flow has no alternative paths, it can be interrupted at any moment. Without redundancy, it’s a «fair‑weather» system—and meteorology, precisely, must be a system that works in «bad weather.» No matter how secure the fiber optics from the radar to the end users are, at some stretch it can break, or run out of backup power. This happened to us in Cuba with the Pico San Juan radar during Hurricane Irma (read that post and draw your own conclusions). Note, dear reader, that I didn’t say «from the radar to the forecast center»—I said «to the end users.» Radar data should impact the end users directly (population, businesses, institutions, media).
Linked to that is data archiving. A radar surveillance system must have its own and duplicated data archive, in different locations, with protections, with duplicated backups. Otherwise, it’s a waste of the money invested in the radar—like throwing the investment in the trash. True, the primary use of radar data is operational forecasting, but the data archive is essential for studying climatology, for studying long‑term drought (by the absence of radar‑measured rainfall data), and for applying Big Data techniques to gain new knowledge.
It’s very good to put data on public servers (like AWS); but the data put there must be in a uniform, accessible, and known format. If it’s stored in a proprietary format, you’re using public foreign servers as a substitute for the institutional archive that should belong to the institution—that’s my opinion in light of my long experience. A bomb in AWS servers and the archive is gone. Does that sound far‑fetched? Amazon and other big players have built their data centers in the Middle East, and we all know what can happen there—besides, ownership of that information passes to the foreign operator.
The National Center for Atmospheric Research (NCAR) has placed the primary and secondary data from all 159 NWS radars on AWS servers. The formats of these data (Level II and Level III) are known, and the NWS has released the ORPG code for many years. We ourselves (LADETEC) have developed an application to read Level III data (LAMULA™ WebViewer), an application to read Level II data (LAMULA™ Process), and an application to convert primary data from any radar into Level II format (LAMULA™ ORPG)—all thanks to the fact that the data, the formats, and the programs are freely available. That, in my opinion, is the right and sustainable path to promote the use of radar information. Old radar data is invaluable for training and improving numerical forecast models for the country in question.
Staying tied to the manufacturer’s software is unsustainable in the long run, in addition to the inconveniences of after‑sales service delays. After some time, the manufacturer has no obligation to maintain compatibility with older versions. If that happens, the country or institution that stored the data in the manufacturer’s proprietary format either abandons them or pays a lot of money to someone to write rescue software.
Human factor and role definition
So far we’ve talked about machines, institutional agreements, and data flows. But the most fragile link—and at the same time the most valuable—in this whole chain is the person on the other side of the screen. It’s not enough to have the world’s most expensive radar if the operator can’t interpret a tornado echo or doesn’t distinguish between ground clutter and a real convective cell.
The organization must clearly define, in writing, the profiles of each position: the maintenance technician (who looks after the electrical and mechanical health of the radar), the operational meteorologist (who monitors data quality and decides changes in scanning mode), the shift supervisor (who authorizes the issuance of alerts and coordinates with other institutions), and the data archiving officer (who ensures that the information is not lost).
From the definition of positions and their work contents, you must define the training plans for each one.
But defining positions isn’t enough. You must establish clear chains of command for emergency situations. When the hurricane is 100 km off the coast and the radar starts giving intermittent faults, the operator cannot be calling their boss, who calls another boss, and so on. At that moment, the organization must have foreseen who makes which decision and within how many seconds.
Writing manuals: the radar’s «road book»
A radar is not operated by intuition or by the memory of those who have been there the longest. That memory retires, gets sick, or leaves for another institution. A serious organization stands on living documents, updated and accessible.
Here I refer to two types of manuals, distinct but complementary:
Operations manual: contains step‑by‑step instructions for starting up the radar, configuring the different VCPs (scan modes), starting data recording, switching channels (H/V), and performing daily noise and gain checks. It’s the equivalent of the car owner’s manual, but specific to each radar model and the particular conditions of its installation (altitude, climate, local interference).
Procedures manual: this is more strategic. It says what to do for each scenario. For example: «If reflectivity > 55 dBZ is detected within 20 km, switch to the severe‑storm VCP and notify the shift supervisor within 2 minutes.» Or «If the transmitter fails during a storm, activate the backup radar (if available) or fall back to the rain‑gauge network and satellite, and report the incident to technical support within the next 5 minutes.»
Writing these manuals takes time, effort, and above all, field testing. They are not drafted from an office far from the radar. They are built with the participation of the operators and technicians themselves, because they are the ones who know the quirks and virtues of their machine. Once written, they must be printed right next to the control station and also available in digital format on several devices. The perfect manual is useless if it’s locked in a drawer.
Training
Training is a continuous process. Annually, for each position, it is necessary to organize training for the staff, taking into account the competencies expected of them and their knowledge from other fields—therefore, it is done for each individual. I knew very good practices under the direction of Professor M. T. Abshaev at the Anti‑Hail Service in the North Caucasus. Both engineers and meteorologists were retrained every couple of years, because, as Abshaev told me, «we teachers ourselves learn new things every time.»
Technical support
Technical support for one or several radars takes one of two forms: (1) build your own team of engineers, or (2) contract the service to a third party (outsourcing, as they call it).
Good radar engineers are not abundant in the world, that’s the truth. Even radar manufacturers are not flush with good integration engineers—those who know all the systems and the whole assembly in detail. The radar is such a complicated machine that it takes a long time to fully assimilate. Manufacturers pay their engineers very well to keep them from leaving for other things—not necessarily even other radar firms. Since so many fields converge in radars (take a look at this post to convince yourself), those engineers leave and succeed brilliantly in any of them. So it’s not easy for any country/institution to have its own engineers.
Some countries/institutions choose to pay a third party and «not worry» (as if that were possible) about the technical service of their radars. They generally turn to a local technology company. That company, in turn, is forced to establish contact with the manufacturer. Here there is a whole spectrum of intermediaries and manufacturers. Things can go well, badly, or so‑so. But what I am sure of is that they will pay a lot of money, and as for the result—I wish them luck. Whether you have your own engineers or not, you should have a hybrid expert who knows radar technology and its meteorological applications, so they can demand proper service from whoever is contracted for technical support.
In my experience, the only sustainable option is to have the experts in‑house. The best examples: Argentina and Brazil.
Execution
Execution is when the storm knocks on your door. When the «movie director» shouts: Action!
Planning and organizing are desk exercises and meetings. Execution is the heat of battle. It’s the moment when the operator puts down their coffee, sits in front of the screens, and puts everything they prepared into practice. Execution is not improvisation; it’s the perfect staging of the manuals and the roles.
Execution consists of five synchronized movements:
1. Active monitoring and hot quality control. The operator cannot passively watch the colors on the screen. They must be hunting for anomalies in real time: radio‑frequency interference, bird or insect echoes, attenuation by heavy rain that hides areas behind the storm. If they detect a spurious datum, they must have the skill and authority to apply filters or to null that measurement before it reaches the end user. It’s like being an airplane pilot: you don’t just watch the instruments; you listen to the engine and feel the vibrations.
2. Agile and decisive switching of scan modes (VCP). We already defined the VCPs during organization. In execution, the operator must decide, in seconds, which one is most suitable. A severe phenomenon can be born, grow, and die in 10 to 15 minutes. If the operator takes 5 minutes to decide that they need to switch to a faster scan and lower elevations, they’ve already missed the storm’s development phase. Execution here is muscle memory: knowing which button to press and which parameter to modify without hesitation, even when the phone is ringing and the boss is looking over your shoulder.
3. Rigorous application of the manuals (SOPs) during a contingency. This is where all the effort of writing the manuals pays off. When the radar goes blind in the middle of a hurricane—as happened to Cuba with the Pico San Juan radar—the operator has no time to invent. They must open the procedures manual and follow the action sequence: check power sources, restart the system, activate the alternate data link, notify technical support, and meanwhile switch to secondary data sources (satellite, rain gauges). Disciplined execution, step by step, is what separates a professional service from chaos.
4. Real‑time inter‑institutional coordination (the Modus Vivendi in action). The agreements with Civil Aviation, Civil Defense, or IDEAM are already signed. But executing them means picking up the phone and saying: «Hey, our radar detects wind shear on the runway—activate your flight‑diversion protocol.» Or warning the mayor’s office: «We have 80 mm of accumulated rain in the river basin—evacuate the riverbanks in 30 minutes.» Waiting for the other party to call is not an option; proactive execution saves lives.
5. Generation and dissemination of the final product to the user. Reflectivity or velocity data is cryptic to a firefighter or an ordinary citizen. Executing well means translating that information into a clear, georeferenced, actionable message: «Imminent flooding in neighborhood X, street Y, at 14:30.» And it’s not enough to upload it to a website. You must push it actively via audible alarms, mobile apps, text messages, and bulletins to the press. The end user doesn’t have to be a meteorologist; the radar’s execution ends when that user understands the danger and acts accordingly.
Control
Control is measuring to improve, auditing to avoid failure. The radar is neither an ornament nor a trophy.
Once it’s operating and all missions have been executed, you have to sit down calmly and evaluate the results. Control is the feedback loop of the system. Without control, organization and planning become obsolete, and execution becomes mechanical routine.
Control operates on three levels:
1. Control of the data flow. The data flow must be checked and logged for statistical purposes. You check whether the radar executed the observation, and then you log its presence at every instance it must pass through—both the primary data and the derived products. In Cuba we developed software for this (VESTA|Supervisor) that automatically checked the entire flow and displayed a map of Cuba where each radar appeared as a small circle with a color code that showed at a glance what had happened with each observation. It also monitored the actions executed by the operators and left a text log of every comment, warning, or alert issued by each operator.
2. Control of the final data quality. It’s not enough to calibrate the radar every so often. You must systematically compare radar‑estimated rainfall with ground‑based rain‑gauge data. If the radar says 50 mm fell and the gauges show 35 mm, there’s a deviation to correct in the algorithms. This cross‑check should be done weekly or monthly, and its results documented to adjust calibration parameters. Also, you must check the performance of the algorithms for hail, mesocyclones, tornadoes, and downbursts. Likewise, check the Particle Classifier, which must distinguish rain, hail, snow, ground targets, birds, and insects.
3. Control of compliance with procedures. After each significant event (a hurricane, a hailstorm, a tornado), a lessons‑learned meeting should be held. Was the correct VCP applied? Did the operator follow the manual to the letter? Were there delays in notification? Did technical support respond within the agreed time? This is not about finding someone to blame, but about identifying deviations to correct the manuals and improve staff training. If a procedure is not followed because it’s impossible to follow, then the problem is in the manual, not in the person.
4. Control of archiving and data sustainability. The data archive is not a drawer where you throw information and forget it. Control requires periodic audits of the backup system. Are the data being copied to the two different locations at the agreed frequency? Are the formats still readable? Have emergency restorations been tested? Many institutions store data for years without ever verifying that they can actually be read. Good control means performing restoration tests at least once a year.
Control closes the loop. Its findings must feed back into Planning: if spare parts ran out faster than expected, readjust the stock. If a manual was confusing, rewrite it. If an operator made an error, reinforce their training. Weather radar surveillance is not a project that ends; it’s a living process that perfects itself with each cycle.
So far we have gone through the entire life cycle of a weather radar surveillance service: we planned it with our feet on the ground, we organized it with workshop discipline, we executed it with the coolness of someone who knows that every second counts, and we controlled it with the critical eye of someone who is not satisfied with what «seems» to work.
If there is one idea I want you to burn into your memory after reading these lines, it is this: the radar is not a household appliance that you plug in and forget; it is a living system that demands daily attention, technical care, and a long‑term vision. He who buys a radar thinking he has bought «automatic weather safety» is buying, in reality, an expensive disappointment. He who buys a radar knowing that he has to plan, organize, execute, and control is buying a tool that can save lives, protect crops, and guide decision‑making for decades.
But the knowledge doesn’t end here. Every radar is a different world, every country has its unique phenomena, every institution has its limitations and strengths. What I have shared with you is the fruit of many years of work, of mistakes learned from and successes celebrated—but I’m sure there is much more to say and do.
That’s why I invite you to contact me. If you are in the process of acquiring a radar, if you already have one and don’t know where to start organizing it, if your radar is «alive but limping,» or if you simply want to exchange views with someone who has been in the trenches, I am at your disposal.
You can write to me at [email protected], visit our website at https://ladetec.com, or find me on professional and social networks. I don’t promise to have all the answers, but I do promise to listen carefully, to share what I know, and if I don’t know something, to look together for someone who can help.
Because weather radar surveillance is not a one‑person or one‑institution affair. It’s a collective effort, and the more we share knowledge, the better prepared we will all be when the storm—inevitably—arrives.
Thank you for reading this far. This post is long, but it’s the material of an entire course in which I try to explain my long practice with Cuban radars in the radar surveillance service. Now, put on your helmets, turn on the radar, and… happy surveillance!
If you’re asking me about a band, I would say without hesitation that the Beatles are the best band of all time. Their music, along with the songs of Cuban singer-songwriter Silvio Rodríguez, is the only music I can listen to repeatedly without ever getting bored. But wait—if you meant a different kind of band, like the frequency band used in weather surveillance radars, my answer is equally definitive: the S band, which is employed by the eight radars operated by the Institute of Meteorology of Cuba. If my skeptical reader thinks I’m being too categorical and suspects that my statement is hasty or biased, I encourage you to keep reading and draw your own conclusions from the evidence I’ll present. But first, let’s clarify some concepts before we delve into selecting the optimal radar operating band.
Over the past year, our team has dedicated significant effort to crafting multiple technical solutions tailored to the needs of developing countries. Take a look,
La société LADETEC, fondée par des spécialistes en radar avec une expérience étendue à l’Institut de Météorologie de Cuba, s’est imposée comme un acteur fiable et compétent dans le domaine de la technologie radar. Leurs réalisations et leurs capacités sont remarquables.
Компания LADETEC, основанная специалистами по радарной технике с обширным опытом работы в Кубинском институте метеорологии, зарекомендовала себя как надежный и компетентный участник на рынке радиолокационных технологий. Их достижения и возможности достойны внимания.
LADETEC is a small company, founded by radar specialists with extensive experience (more than 30 years) in the Cuban Institute of Meteorology. It has established itself as a reliable and proficient entity in the radar technology field. Their achievements and capabilities are notable:
LADETEC is a small company, founded by radar specialists with extensive experience (more than 30 years) in the Cuban Institute of Meteorology. It has established itself as a reliable and proficient entity in the radar technology field. Their achievements and capabilities are notable:
Había una vez…Los Radares Japoneses, el inicio de una Nueva Era en la Meteorología Cubana.
Toward the end of the sixties of the 20th Century, United Nation Development Program (UNDP), considering the frequency, intensity and destructive capabilities of hurricanes in the Caribbean Basin, evaluated and accepted a request from some countries belonging to the CARICOM, to supply equipment to arrange a “curtain of 10 cm weather radars” against hurricanes in the Caribbean together with radars in the French Departments of Lesser Antilles, Puerto Rico and Miami. At the same time, UNDP received an independent request through the World Meteorological Organization (WMO) from the Academy of Science of Cuba. UNDP-WMO, having a favorable financial situation, decided to complain with both requests. Hacia fines de la década de los sesenta del siglo XX, el Programa de las Naciones Unidas para el Desarrollo (PNUD), considerando la frecuencia, intensidad y capacidad destructiva de los huracanes en la cuenca del Caribe, evaluó y aceptó una solicitud de algunos países pertenecientes a CARICOM, para suministrar equipos disponer una “cortina de radares meteorológicos de 10 cm” contra huracanes en el Caribe junto con radares en los departamentos franceses de las Antillas Menores, Puerto Rico y Miami. Al mismo tiempo, el PNUD recibió una solicitud independiente a través de la Organización Meteorológica Mundial (OMM) de la Academia de Ciencias de Cuba. El PNUD-OMM, teniendo una situación financiera favorable, decidió cumplir con ambas solicitudes.
In 1996 hurricane Lili caused big losses in the central region of Cuba. Provinces of Cienfuegos, Sancti Spiritus and Villa Clara were severely affected. MRL-5 radar at Pico San Juan worked well all the time the hurricane passed, but it lost radio and telephone communication with the rest of Cuban Meteorological Institute.
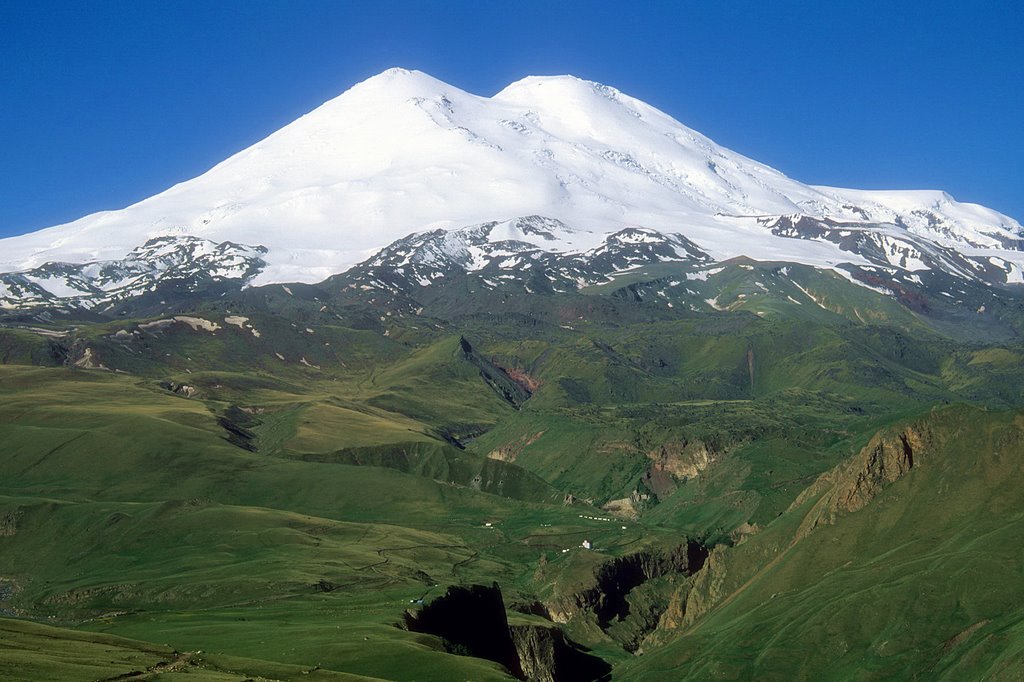
Mount Whitney, highest peak in contiguos United States.
While making our new Doppler radar, the Laboratorio de Desarrollo Técnico (LADETEC) arrived at a road cross: VESTA|Process (our product generator) could visualize Velocity data only in a very rusty way. No further Velocity and Spectrum Width processing was available, but a Doppler radar needs some software able to generate products using Velocity and Spectrum Width.
So, re-write code adding new features or use some other software? That was the question.
It took many years for Cuban Meteorological Institute to reach two very important characteristics in radar exploitation: INDEPENDENCE and SUSTAINABILITY. Those are weird features in modern life, especially for developing countries. That looks like swimming against the tide. Nowadays, almost everything is designed to be changed for another model in a short time. In the seventies, companies like Mitsubishi were very proud building radars with ALL parts made by Mitsubishi; so did Soviet Electromash Factory. Nowadays most companies ASSEMBLE radars using parts from many different manufacturers. Cell phones are supposed to be changed frequently, so they are produced and sold by millions. That is not the case with radars, which are supposed to be on duty for 10-15 years. What can the companies do to keep economically solvent, selling expensive radars…rarely?
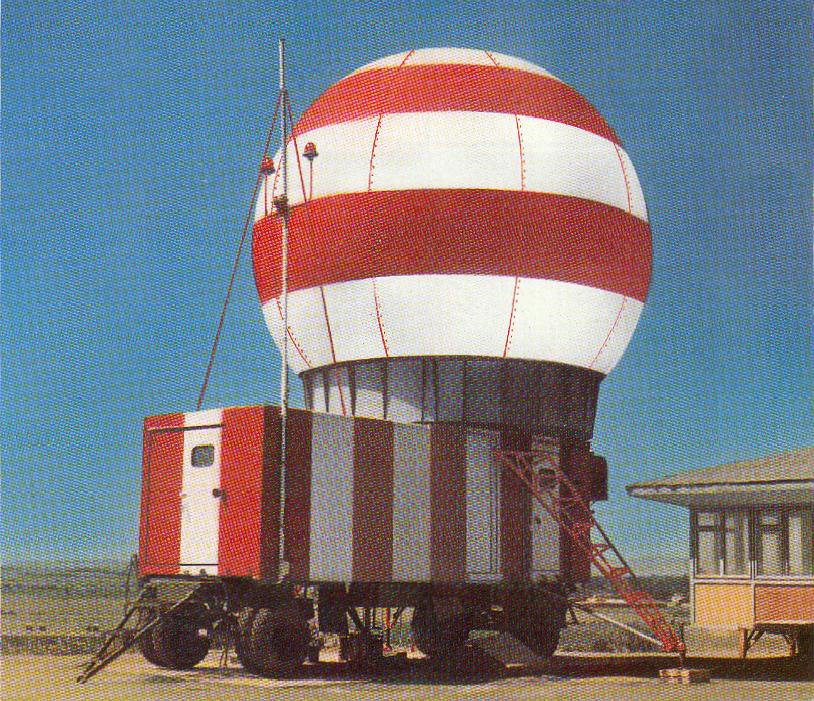
Mobile version (container-mounted ) of Camagüey in 1981.
Once upon the times there was a radar named MRL-5 (МРЛ-5 in Russian). Believe you, my dear and incredulous reader, or not, my whole professional and personal life has turned around this radar all the time, until now. The first MRL-5 deployed in Cuba was given to me as my “26 years old birthday gift” on December 16, 1981, when I had just one month of “experience” as a worker. My Boss (Dr. Braulio Lapinel) said—»you ARE and WILL BE FOREVER the ENGINEER” of this MRL-5 radar, so, go and sign all the acceptance papers in the name of Cuban Meteorological Institute. I was proud of being named engineer, but I was reluctant of doing what he wanted me to do. (más…)
Cookie Consent
We use cookies to improve your experience on our site. By using our site, you consent to cookies.
Used to monitor number of Google Analytics server requests
10 minutes
__utmb
Used to distinguish new sessions and visits. This cookie is set when the GA.js javascript library is loaded and there is no existing __utmb cookie. The cookie is updated every time data is sent to the Google Analytics server.
30 minutes after last activity
__utmc
Used only with old Urchin versions of Google Analytics and not with GA.js. Was used to distinguish between new sessions and visits at the end of a session.
End of session (browser)
__utmz
Contains information about the traffic source or campaign that directed user to the website. The cookie is set when the GA.js javascript is loaded and updated when data is sent to the Google Anaytics server
6 months after last activity
__utmv
Contains custom information set by the web developer via the _setCustomVar method in Google Analytics. This cookie is updated every time new data is sent to the Google Analytics server.
2 years after last activity
__utmx
Used to determine whether a user is included in an A / B or Multivariate test.
18 months
_ga
ID used to identify users
2 years
_gali
Used by Google Analytics to determine which links on a page are being clicked
30 seconds
_ga_
ID used to identify users
2 years
_gid
ID used to identify users for 24 hours after last activity
24 hours
_gat
Used to monitor number of Google Analytics server requests when using Google Tag Manager
1 minute
_gac_
Contains information related to marketing campaigns of the user. These are shared with Google AdWords / Google Ads when the Google Ads and Google Analytics accounts are linked together.