
If you’re asking me about a band, I would say without hesitation that the Beatles are the best band of all time. Their music, along with the songs of Cuban singer-songwriter Silvio Rodríguez, is the only music I can listen to repeatedly without ever getting bored. But wait—if you meant a different kind of band, like the frequency band used in weather surveillance radars, my answer is equally definitive: the S band, which is employed by the eight radars operated by the Institute of Meteorology of Cuba. If my skeptical reader thinks I’m being too categorical and suspects that my statement is hasty or biased, I encourage you to keep reading and draw your own conclusions from the evidence I’ll present. But first, let’s clarify some concepts before we delve into selecting the optimal radar operating band.
The Electromagnetic Spectrum and Its Bands
The electromagnetic spectrum refers to the energy distribution of all electromagnetic waves. The electromagnetic spectrum extends from the shortest wavelengths, like gamma rays and X-rays, through ultraviolet light, visible light, and infrared rays, to the longest electromagnetic waves, like radio waves. It is believed that the limit for the smallest possible wavelength is the Planck length, while the maximum limit could be the size of the Universe, although formally, the electromagnetic spectrum is infinite and continuous. I emphasize the term «continuous» because the division into bands is just a way we humans group frequencies, whose usage and properties make them similar.
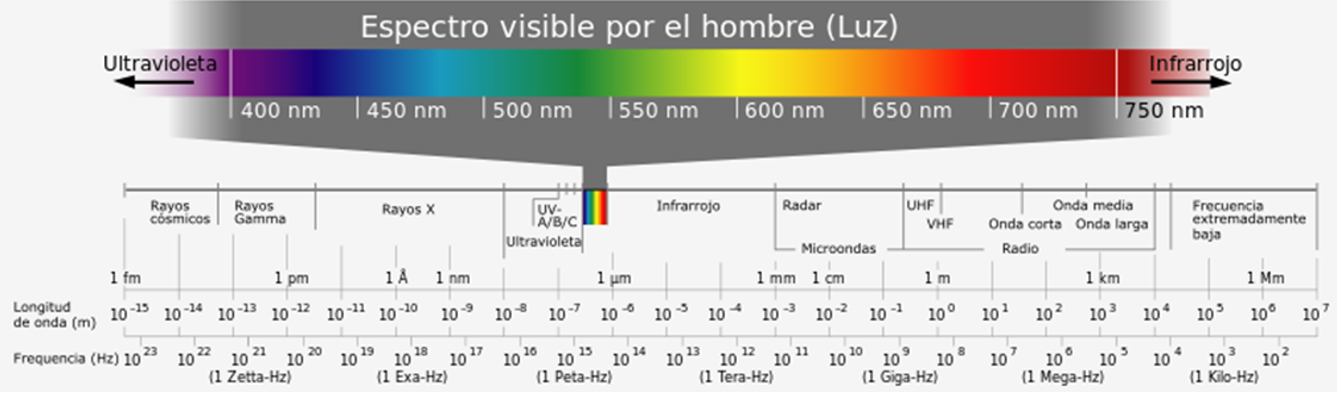
Electromagnetic radiation is characterized by its frequency (f, expressed in Hertz) and its wavelength (λ, expressed in meters). These are reciprocal magnitudes and are linked by C, the speed of light in the medium, so that C = λ·f. In meteorology, only a small fraction of the entire electromagnetic spectrum is used, as shown in the following table.
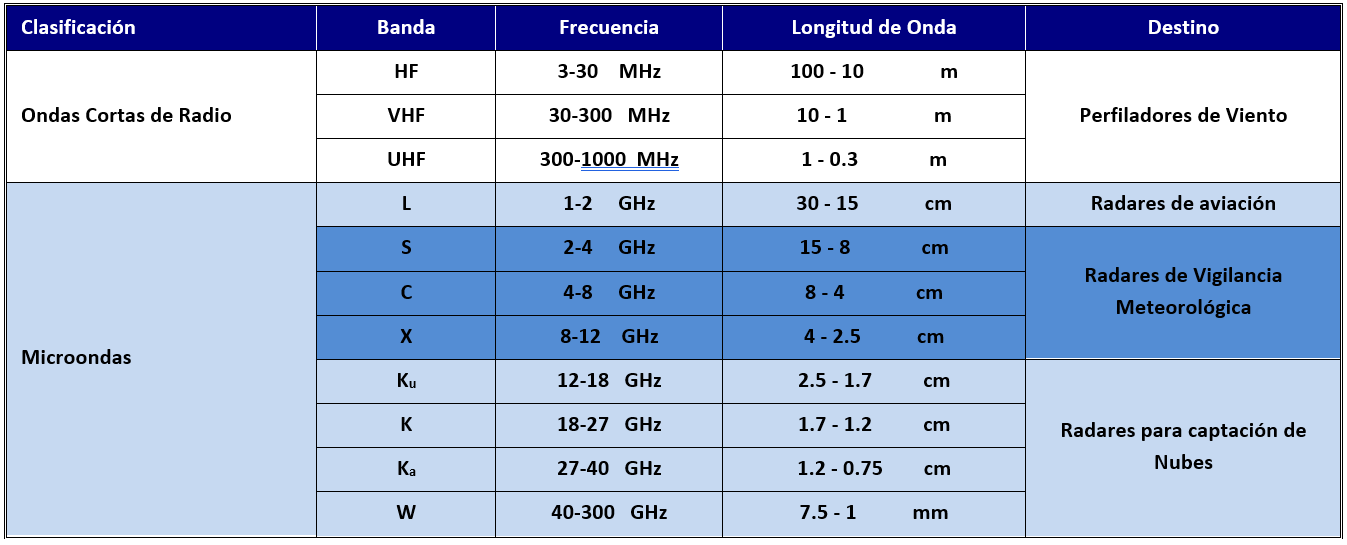
Weather surveillance radars operate at frequencies (wavelengths) in three different bands: the S band, the C band, and the X band, whose properties differ in many aspects. In the S band, weather radars mostly occupy the 2.7 to 2.9 GHz sector, but there are also radars that operate from 3.0 to 3.5 GHz. In the C band, weather radars occupy a narrow sector from 5.4 to 5.65 GHz. In the X band, weather radars operate between 9.3 and 9.5 GHz, although some operate up to 10.0 GHz.
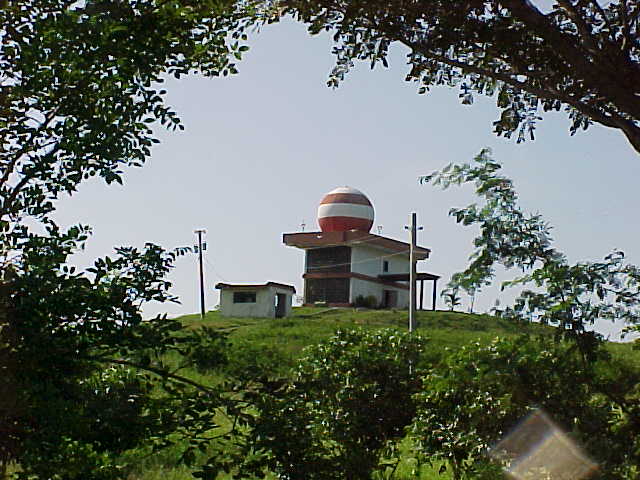
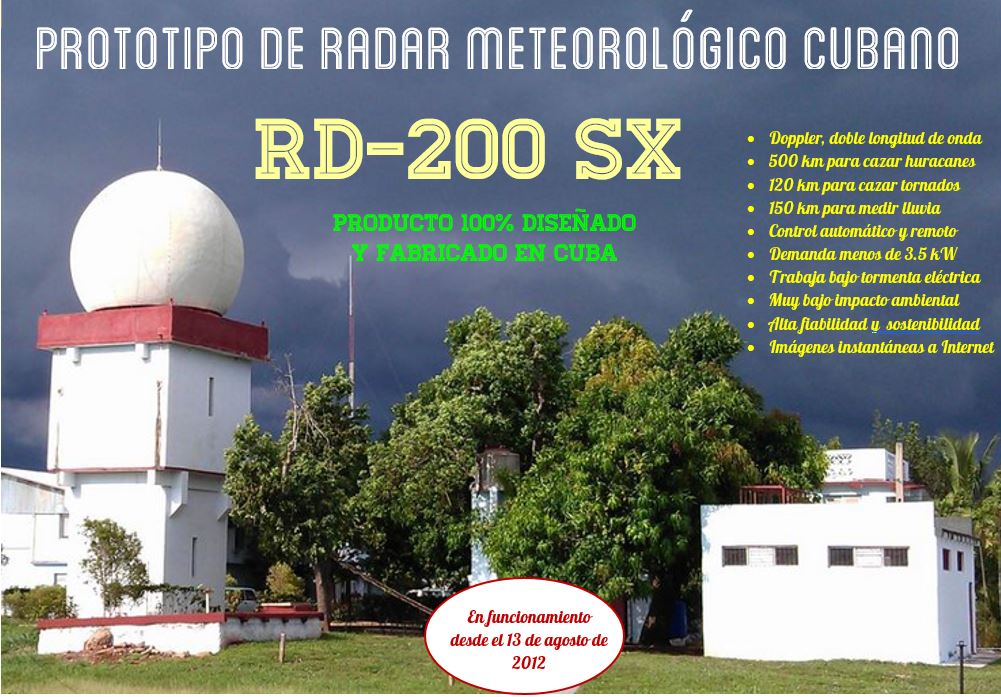
The old MRL-5 radars (of which there are 4 in Cuba) operate with dual wavelengths (S and X bands); in the S band, they work between 2.95 and 2.98 GHz, and in the X band, they work at 9.595 GHz with tunable magnetrons. In Cuba, all radars operate in the S band, at frequencies between 2.74 and 2.98 GHz. The RD-200 SX Doppler radar in Camagüey, built using the infrastructure of an MRL-5 radar, retains the X band too.
Weather Radars Around the World
It is estimated that there are currently over 1,500 weather radars in use worldwide. The WMO Weather Radar Database lists 845 radars reported by meteorological services. In this database, 40% of the radars are S-band, 53% are C-band, and only 7% are X-band. The highest concentration is in Europe and North America.

The U.S. meteorological service uses 160 S-band radars, and the airport service complements this network with 45 C-band radars. The CASA network of cheap radars improves low-altitude coverage with X-band radars, just as the Climavision radars do.
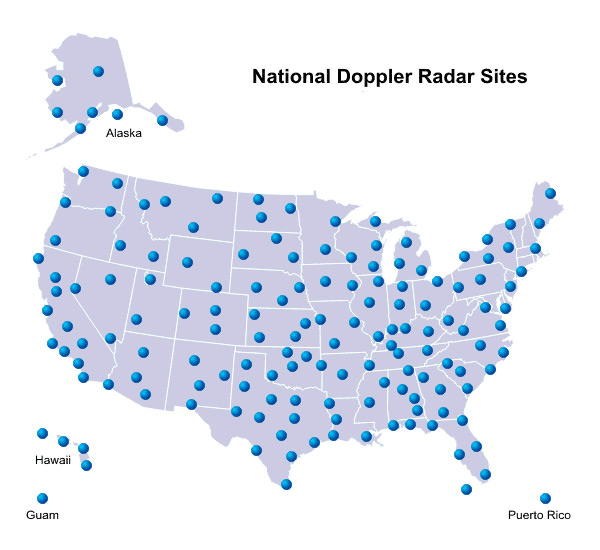
In Europe, the EUMETNET OPERA project gathers 200 radars from 30 countries, mostly C-band, with some X-band and others S-band, using very different technologies and years of manufacture.

The Canadian network operates 33 S-band radars, whose installation has just been completed.

For its territory Cuba has a high density of radars, ahead of many developed countries, ranking seventh in the number of radars per surface area. Weather radars are a matter of national security and in that respect, Cuba is doing quite well.

Differences Between the Three Bands
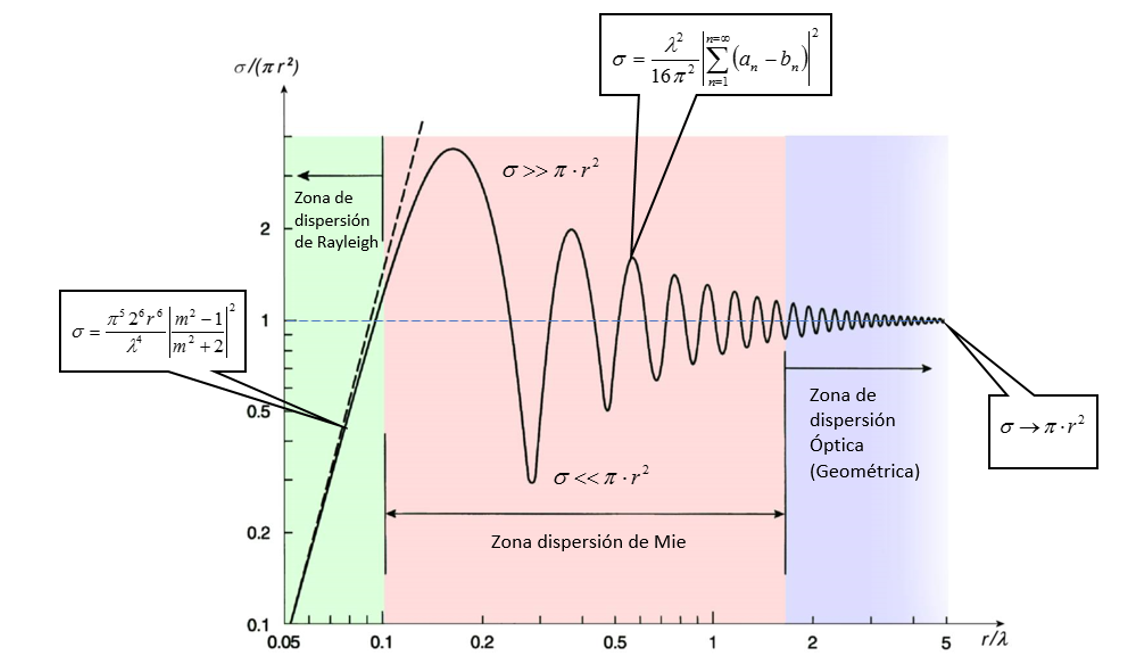
Weather radars in the S, C, and X bands behave differently depending on the frequency band they operate in. These differences are due to the interaction of microwaves of different frequencies with the microphysics of meteorological objects (see the following chart) and also to the technical characteristics of radars that can reasonably (for technical and economic reasons) be manufactured in each operating band. Let’s look at the different aspects where it is important to compare radars from these three bands.
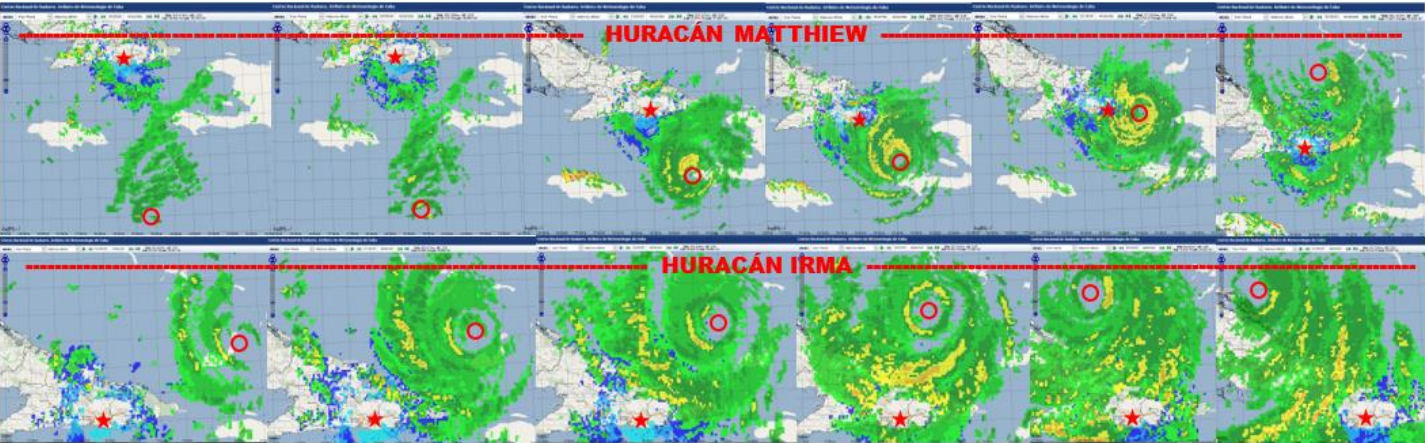
Range. There isn’t much to explain here; one would always want their radar to have the maximum possible range. This quality is very important for detecting and tracking hurricanes. Roughly speaking, S-band radars are used for detecting severe weather phenomena, up to 500 km, and are recommended (I’d say mandatory) for countries within the tropical belt. C-band radars are for moderate climates and usually have an effective range of no more than 250 km. X-band radars are for special short-range applications, typically used up to about 60 km, generally to complement radar networks in other bands, as CASA and CLIMAVSION do in the U.S. This doesn’t mean that, say, X-band radars can’t reach 500 km. They can, but other factors may limit their performance at that distance. See two examples of the Gran Piedra radar detecting Hurricanes Matthew and Irma.
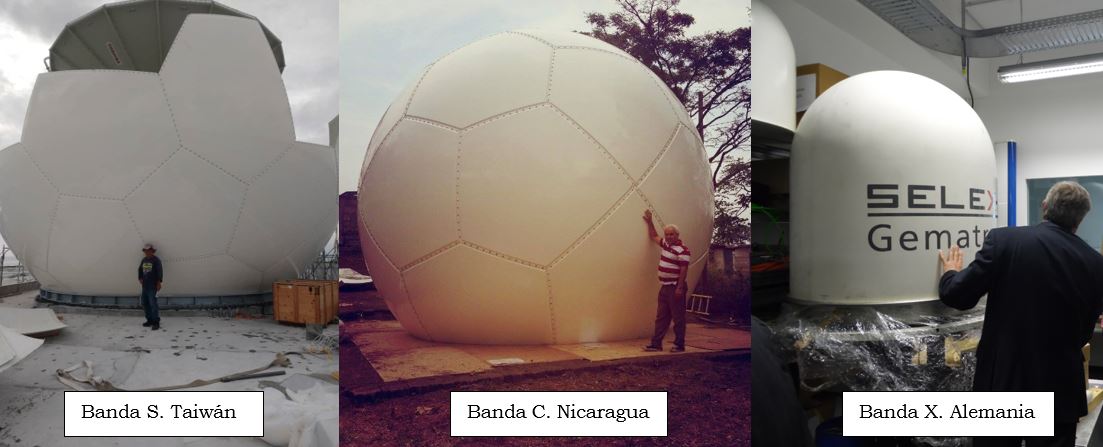
Size/Cost. Under equal conditions (to achieve the same parameters), S-band radars are very large, and X-band radars are the smallest, with C-band radars being intermediate between these two types. Consequently, S-band radars are the most expensive, and X-band radars the cheapest, with C-band radars being of intermediate cost. See the following photo for an example of the three types shown by Ichi.
Doppler Mode. In Doppler mode, weather radars are used to estimate the velocity of particles within meteorological objects. Essentially, the maximum velocity that a Doppler radar can estimate depends on two factors: the wavelength the radar operates at (λ, expressed in meters) and the pulse repetition frequency of the transmitter (Fr, expressed in Hertz), linked by the equation: Vmax = λ Fr /4. Let’s compare Doppler radars from the three bands (S, C, and X) operating at three repetition frequencies (500, 1000, and 2000 Hz). The following table shows the maximum Doppler velocities that could be measured by S, C, and X-band radars operating at these repetition frequencies.

Raising the repetition frequency above 1000 Hz is not advisable because it reduces the maximum working distance (Rmax, in meters) due to what we call the Doppler Dilemma, expressed as Rmax·Vmax = λ·C /8, meaning that the product Rmax·Vmax is constant for a given wavelength. See the following table for the maximum velocities that can be measured by Doppler radars from the three bands, at four distances (50 km, 150 km, 250 km, and 500 km).
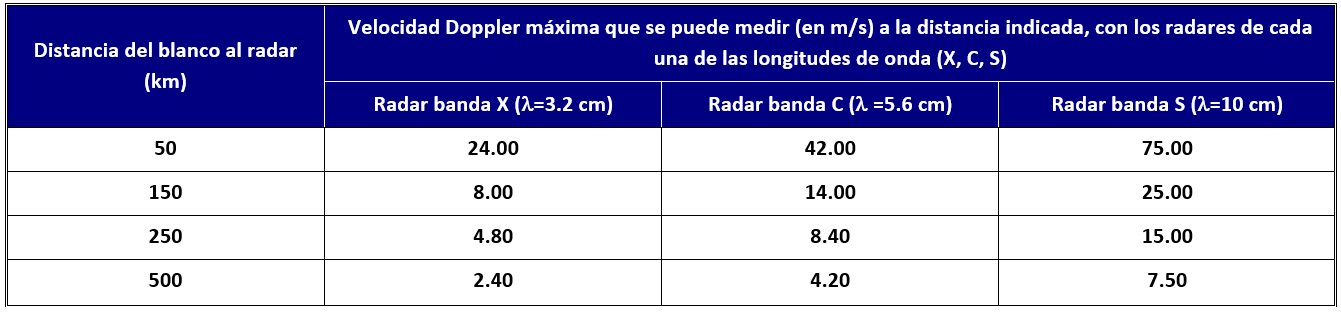
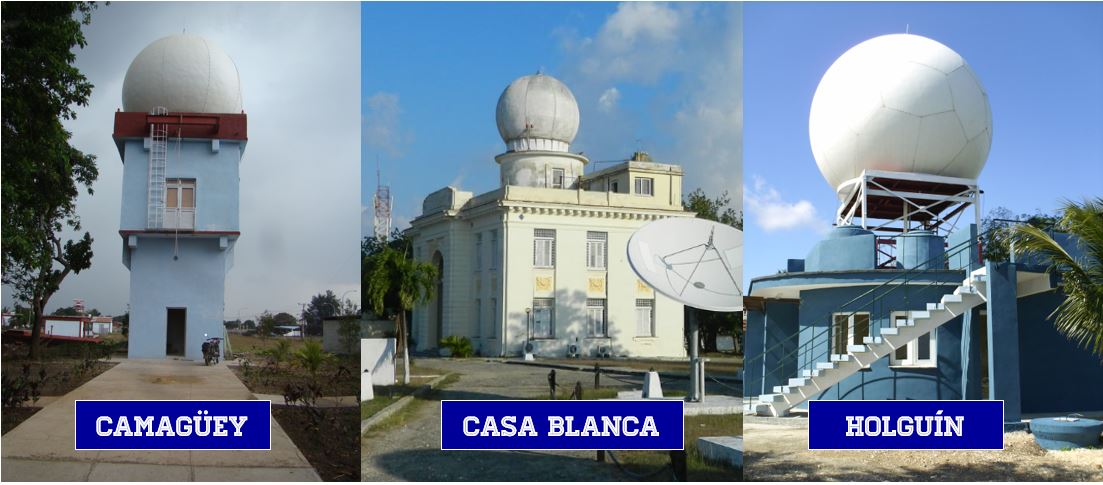
As you can see, at any distance, the S-band radar can measure the highest Doppler velocity, and with the X-band radar, the highest measurable velocity is much lower. Of course, any Doppler radar can have algorithms applied to increase the maximum velocity measurement limit by a factor of 2, 3, or 4 times (this applies to all three bands). However, this is done at the expense of the quality of the velocity estimates. In Cuba, LADETEC manufactured three Doppler radars.
Detection of Weak Objects. Although it may seem that weather surveillance radars should only interest us in detecting and tracking intense weather phenomena such as local storms, hailstorms, downbursts, tornadoes, and cyclones, there are many applications where phenomena that generate low-intensity signals in the radar (low Reflectivity, see the article «What Do Weather Radars Measure?») may interest us.
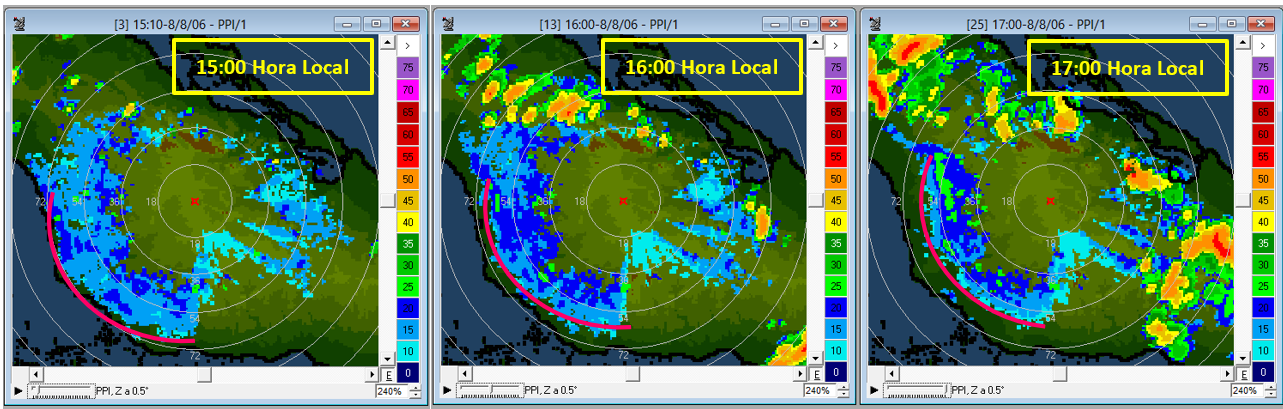
There are phenomena like dust storms, gust fronts, breeze fronts (the case of the photo above this text, entry of a breeze front, captured by the Camagüey radar, courtesy of Rafael Valdés), light precipitation, the emergence of convergence lines, and others, that do not generate strong signals but are associated with other phenomena and are, in some way, precursors or indicators of other dangerous phenomena. So, we might also be interested in knowing how the operating band influences the radar’s ability to detect weak objects. See the following graph to clarify this.
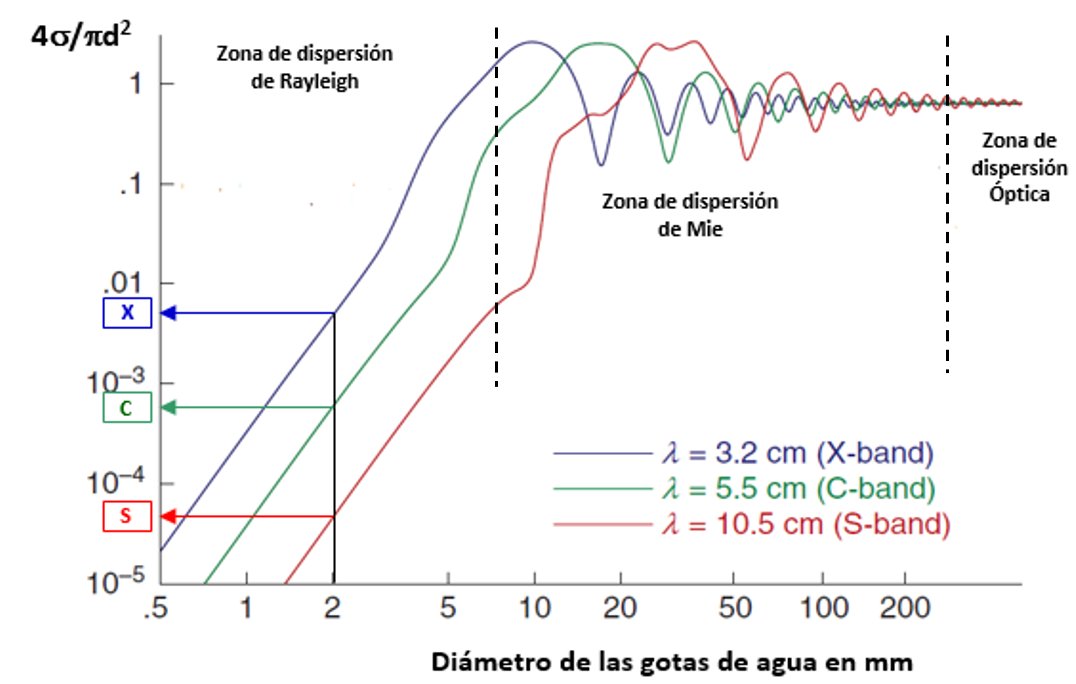
The conclusion we can draw is that for the same particle size, we get a stronger signal (greater reflectivity) as the wavelength decreases. Therefore, X-band radars detect low-intensity meteorological objects better than C-band radars, and these, in turn, better than S-band radars. That is, if our primary interest is detecting low-intensity phenomena, the choice would be an X-band radar. On the other hand, a radar’s capability (applies to all 3 bands) can be increased by boosting the transmitter power, antenna size, and receiver sensitivity. The RD-200SX Doppler radar combines two channels with S and X bands, thus combining the virtues of both.
Signal Attenuation. The microwave signals used in weather surveillance radars, as they propagate through the atmosphere are subject to the phenomenon of attenuation. Microwave attenuation occurs as they pass through clouds, precipitation, and also in a clear atmosphere, but much less. Rain attenuation is stronger the higher the frequency and, therefore, is maximum for X-band radars, intermediate for C-band radars, and minimum for S-band radars. Attenuation is so strong in X-band radars that it is recommended to limit their working range to 60 km, while in S-band radars, it is practically negligible. The strongest attenuation is in intense, widespread rain, particularly in convective clouds. It should be noted that radars operating in the three bands are also subject to other types of attenuation, such as beam broadening at greater distances and attenuation due tonon-spherical particle shapes (for example, hail). See the following graph to clarify these concepts.

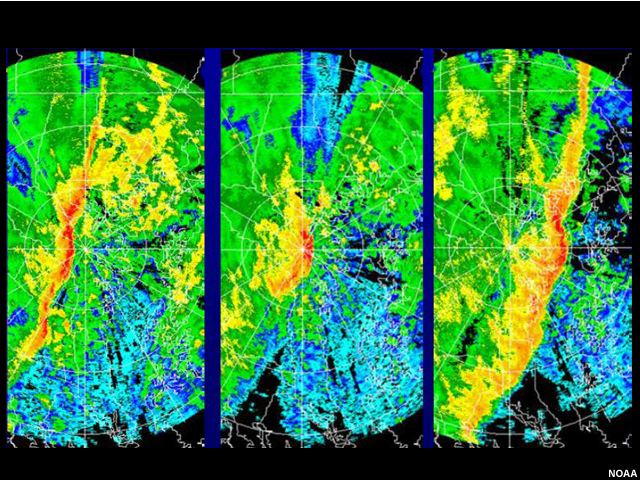
As can be seen, S-band microwaves are practically not attenuated, C-band microwaves are considerably attenuated in intense precipitation, and X-band microwaves are attenuated to the point of disappearing. This is the main factor that limits the range of radars in the different bands. However, this does not mean that radars with a range of 500 km cannot be built in all three bands. What it means is that the longer the working distance for which the radar is intended, the greater the probability that a distant area of precipitation will be masked by a nearby area of intense precipitation when using C-band or X-band radars. See the example of the attenuation of a line of precipitation crossing over the C-band radar.
Let’s consider the example of a radar intended for meteorological surveillance of an airport runway. The radar is located 30 km from the airport runway, and its purpose is to monitor dangerous phenomena that may occur over this runway. In principle, following the previously mentioned criteria, for this surveillance service at an object that is 30 km away, any of the three bands would be suitable: S = 500 km, C = 250 km, and X = 60 km. Let’s consider, for this example, three cases in which a very intense precipitation (200 mm/h) is interposed between the radar and the runway, extending over: Case a) 2 km, Case b) 10 km, and Case c) 20 km. Let’s see in the following table what would happen in these three cases to the signals of three different radars, each operating in one of the three bands S, C, and X.

As can be seen, in areas where heavy precipitation (> 100 mm/h) is abundant, even at short distances of less than 50 km, the attenuation can nullify the purpose for which the radar was purchased if X-band and C-band are used. In the case presented an intense storm over the airport runway would be masked by a precipitation zone interposed between the radar and the runway, and it would go unnoticed.
Polarimetric Hydrometeor Classifier
Identifying the particles that make up the phenomenon observed by radar has long been an aspiration that, to this day, has not been satisfactorily achieved in all cases. With conventional radars—which provided only one variable (Reflectivity, Z) obtained from a single wavelength and single polarity—we could barely distinguish between meteorological targets and ground clutter.
In dual-wavelength radars, such as the Soviet MRL-5 systems, the task of identifying heavy rain or hail was greatly simplified. However, dual-wavelength radars were very expensive instruments. It was only with the commercial advent of dual-polarization radars that this identification task improved substantially, since hydrometeors have different sizes in the horizontal and vertical dimensions.
Let’s examine the principles behind particle identification in polarimetric radars before discussing the specific characteristics of each of the three frequency bands.
Polarimetric Radars and Hydrometeor Classification
Commercially available polarimetric radars use a transmitter whose power is split into two signals: one emitted in horizontal polarization and the other in vertical polarization. They employ dual receivers, one for each polarity.
Like conventional radars, polarimetric radars can estimate the reflectivity of meteorological targets—but they do so for both polarizations, giving us Zh (horizontal reflectivity) and Zv (vertical reflectivity). Similarly, they function as Doppler radars in both polarizations, measuring Doppler velocity and Doppler spectrum width for each.
Additionally, polarimetric radars enable the calculation of other key variables, including: Differential Reflectivity (ZDR), Differential Phase (PHIDP), Specific Differential Phase (KDP), Correlation Coefficient (RHOHV)Differential Attenuation (ADP).
Using all these variables, fuzzy logic algorithms are applied to build hydrometeor classifiers. For reference, see the behavior of two such variables (ZDR and RHOHV) as illustrated in Fabry’s Radar Meteorology.
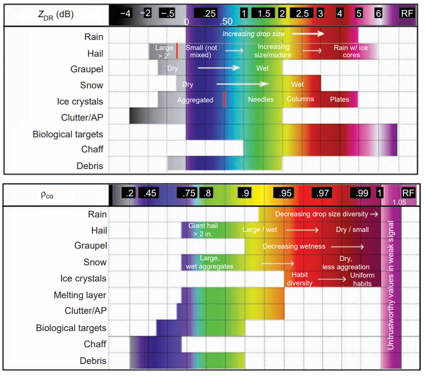
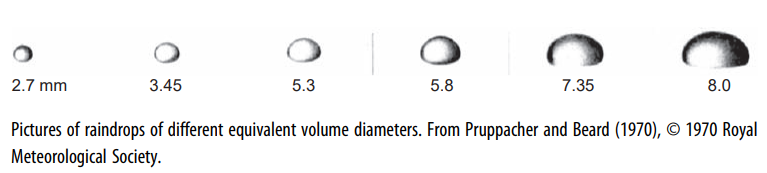
These classifiers perform differently depending on the radar’s operating frequency band. Particle classifiers in C-band and X-band radars are affected by signal attenuation, as previously explained. Additionally, C-band radar classifiers face an issue commonly referred to in the literature as the resonance effect. This occurs when hydrometeors exceed 1.5 cm in diameter, causing microwave scattering to enter the Mie scattering region (also called the resonance zone—see the two previous graphs). As a result, the classifiers encounter: Abnormally high Differential Reflectivity (ZDR) values, Negative Specific Differential Phase (KDP) values, Negative Differential Attenuation (ADP) values. These distortions degrade classifier performance. Neither S-band nor X-band radars exhibit this issue. Thus, once again, S-band radars prove more reliable for such applications like particle classification.
Estimating precipitation intensity (R) using weather radar, while grounded in physical principles, is typically performed through empirical relationships between rainfall rate (R) and radar-measured variables—most commonly reflectivity (Z).
With the advent of polarimetric radars, new empirical relationships have emerged, correlating precipitation intensity (R) primarily with: Horizontal reflectivity (Zh), Differential reflectivity (ZDR), Specific differential phase (KDP), More recently, specific attenuation (A)
These relationships may involve individual variables or combinations thereof. However, no empirical formula to date has proven universally valid for all possible hydrometeor conditions.

On the other hand, polarimetric variables allow us to identify, with a certain degree of certainty, the type of hydrometeors that make up the atmospheric volume illuminated by the radar beam. With this information, we can use one empirical relationship or another that best fits the estimation of precipitation for that specific type of detected hydrometeor.
Despite the initial enthusiasm, empirical relationships involving horizontally measured Reflectivity and Differential Reflectivity, R(Zh, ZDR), have been taking a back seat (especially for C- and X-band radars) in radar-based precipitation estimation. This is because they require Zh to be calibrated with an accuracy of less than 1 dB and ZDR with an accuracy better than 0.1–0.2 dB (believe me, in an experimental radar, this can be achieved with great effort, but in an operational service network, attempting it is impractical).
Empirical relationships using Specific Differential Phase (KDP) are largely immune to the aforementioned radar calibration issues (which is why they are more commonly used in C- and X-bands). However, for low precipitation intensities (R), they are not used because the estimation of KDP itself is very noisy due to the high variability of drop spectra.
In the last four years, relationships based on Specific Attenuation, R(A), have been gaining acceptance, as they perform much better in the S-band than in the more attenuating bands (C and X).
Let’s examine how precipitation estimation behaves depending on the radar band. In general, quantitative precipitation estimation (QPE) is achieved with: S-band radars: up to 230 km, C-band radars: up to 115 km, X-band radars: up to 30 km. Any claim beyond these ranges is purely commercial propaganda without scientific basis.
The R(KDP) relationships are typically used: For S-band, when R > 10–11 mm/h, For C-band, when R > 5–6 mm/h, For X-band, when R > 3 mm/h. This means X-band radar is the best for estimating light precipitation using the R(KDP) method. For weak precipitation, R(A) can be used, which performs much better in S-band. Further reading:
https://es.scribd.com/document/364980547/Baron-White-Paper-Radar-System-Selection
If you SERIOUSLY want to estimate precipitation in the Tropics, get an S-band radar. For a deeper understanding of the topic, read the following paper: “Polarimetric Radar Quantitative Precipitation Estimation” by Alexander Ryzhkov, Pengfei Zhang, Petar Bukovich, Jian Zhang, and Stephen Cocks, published in Remote Sens. 2022, 14, 1695. (https://doi.org/10.3390/rs14071695). All the scientific backing for what I’ve explained is there.
Conclusion I wrote a detailed post explaining why Cuba should not buy radars from foreign manufacturers and another post outlining why Cuba must produce its own radars. When Comandante en Jefe entrusted us with the design and production of the Cuban Meteorological Radar, this feasibility study had already been conducted.
I will only add that all eight Cuban meteorological radars are, quite correctly, S-band, and the Cuban Meteorological Radar was designed as an S-band system (the Camagüey prototype also includes X-band, ideal for atmospheric experiments and research).
Once, a foreign manufacturer managed to dazzle high-ranking Cuban officials with their siren songs, attempting to sell Cuba four C-band radars. Nothing could have been more misguided than replacing four S-band radars with four C-band radars. To make matters worse, they were selling them far above market price, despite offering soft credit terms.
For all the reasons stated earlier, C-band radars do not meet the needs of Cuba’s meteorological service. It would be like trading four cows for four goats. I’ve said it before, and I’ll say it again (and this is no exaggeration). I have a thorough report comparing Cuban radars with those foreign models—as well as with world-reference radars—parameter by parameter.
A Final Thought for the Skeptical Reader
Despite everything I’ve explained in clear terms, my distrustful reader might still think my analysis is biased—that I’m some «S-band fanatic» simply because our Cuban radars use this band.
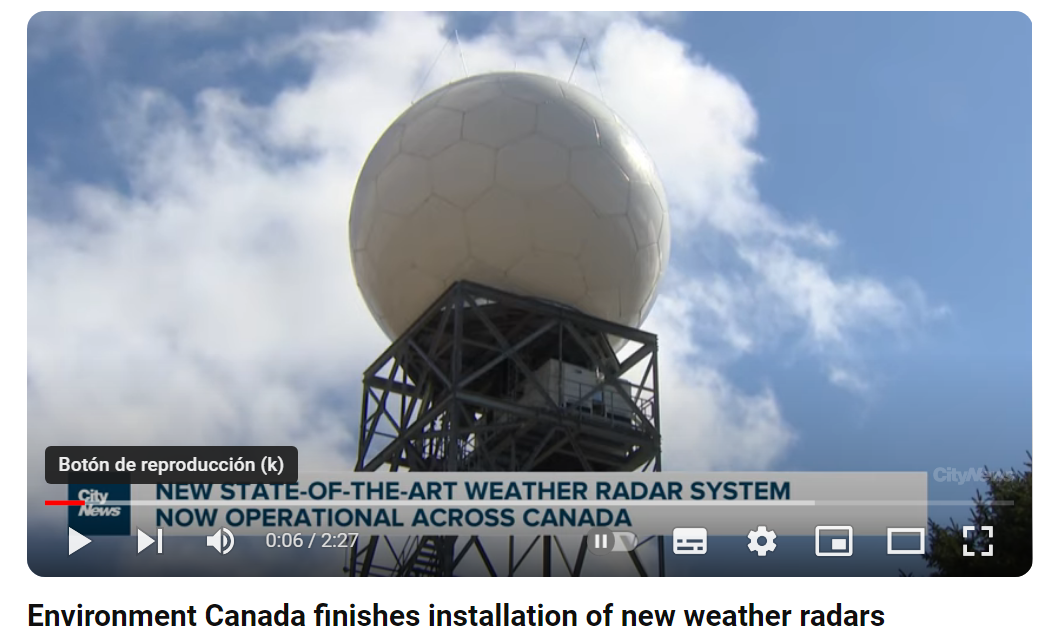
So let me ask you this: Why are all 160 WSR-88DP radars used by the U.S. National Weather Service S-band? Oh, are they «a bit old» now? Then what about the 33 brand-new radars just installed by Environment Canada for the Meteorological Service of Canada? All S-band, replacing their previous generation of C-band radars.
Does that tell you something?
For Those Seeking More Detailed Information
We have a scientific white paper available that provides an in-depth analysis on this matter. The document presents: Technical comparisons between S-band, C-band, and X-band radars. Performance evaluations for tropical precipitation estimation. Case studies from international meteorological services (including the U.S. and Canada). Cost-benefit analysis of radar network deployment. This white paper supports all the technical arguments presented in our discussion with peer-reviewed data and operational evidence.
Interested readers may request access to this document through official channels.
Why Are There So Many C-Band Radars? (The Hard Truth). The Two Perspectives in Radar Procurement
There are two fundamentally opposed viewpoints in meteorological radar acquisition:
1. The Financier-Buyer-Beneficiary Perspective
Primary concern: «What solves our operational needs at sustainable costs?» Prioritizes: Tropical performance (S-band’s superior rain penetration and minimal attenuation). Long-term reliability (proven track record in harsh climates). Lifecycle costs (maintenance, power, downtime). Examples: U.S. NWS (160 S-band WSR-88Ds since 1988, still upgrading). Canada (replaced C-band with S-band in new network). Cuba (8 S-band radars designed for tropical cyclones).
2. The Manufacturer-Seller Perspective
Primary concern: «What maximizes our sales and margins?». Tactics often include: Overpromising C/X-band performance (ignoring tropical attenuation). «Feature inflation» (highlighting secondary capabilities while downplaying core weaknesses). Soft financing traps (low upfront cost, high long-term dependency). Reality check: No major tropical meteorological service uses C/X-band as primary network. Even mid-latitude nations (e.g., Canada) are abandoning C-band for S-band. The Irrefutable Bottom Line: When meteorologists and fiscal planners agree—but sales teams disagree—ask yourself: Who suffers if the wrong band is chosen? (Answer: Forecasters, disaster responders, the public.) Who profits? (Answer: The vendor.)

Let’s start with the first issue. When acquiring a new radar, the primary decision—without a doubt—is determining the frequency band in which the desired radar will operate. In recent years, this decision has been made primarily based on the buyer’s available budget, with technical considerations unfortunately taking a backseat. The one funding the purchase naturally wants to spend as little as possible, settling for anything that can be called a «radar»—regardless of whether it actually meets the needs that justified the purchase in the first place. Meanwhile, the end-user client reluctantly accepts this compromise, adhering to the saying: «Something is better than nothing» (literally, «Even a single hair from the wolf»), or«A bird in the hand is worth a hundred in the bush.». In other words, they fear that if they push too hard for what they truly need, they might end up with no radar at all.

The seller, for their part, employs post-truth tactics (read the post: «Post-Truth and Weather Radars«)—explicitly highlighting what the radar can do while completely omitting what it cannot do or does poorly. In the previous section, I outlined the shortcomings of C-band radars. So why do manufacturers keep pushing them? Simple: because C-band radars offer the best Price/Cost ratio for the manufacturer. S-band radars are the most expensive to produce, yielding far lower profit margins compared to C-band models.

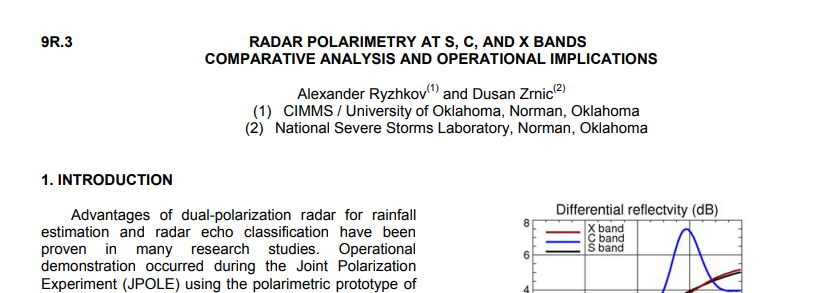
The two perspectives move in the same direction, and everyone involved (the one providing the money, the one receiving the radar, the seller, and the manufacturer) feels happy… at the inauguration ceremony. But the complaints start pouring in when the radar fails to meet expectations. Some colleagues of mine from a certain tropical country, who operate polarimetric C-band radars, once complained to me: «Why does the hydrometeor classification never match pilots’ weather reports?» I hope they’re reading this post. The answer is simple: these radars are good and work well… but under different climatic conditions. For more details, read the following study:
And so, dear reader, I hope I’ve provided you with enough information to decide which radar band to choose. As for me? I’ll stick with The Beatles. Draw your own conclusions.

And remember:
Deja una respuesta